This blog is part of a series related to Gov 1347: Election Analytics, a course at Harvard University taught by Professor Ryan D. Enos.
This week, I am building predictive models for US presidential elections using the following economic variables: Gross Domestic Product (GDP), Real Disposable Income (RDI), and Unemployment. For each model, I’ll apply data from 2020 to evaluate its accuracy and then focus on incumbency. I wrap up by modeling state-level unemployment data and comparing it to the model which uses national level unemployment data.
Economic Variables and 2020
There has been extensive research surrounding the economy and using economic growth as a variable to predict presidential elections, such as detailed in Christopher H. Achen’s and Larry M. Bartels’ Democracy for Realists. Generally, this can be seen as a way that voters are measuring the performance of the incumbent party or incumbent president. Further in this research, there’s evidence that voters only respond to the economy of election years. Andrew Healy and Gabriel S. Lenz suggest that this is due to the fact that thinking about the recent economy when voters go vote is much easier than evaluating the past four years as a whole.
Given this research, I created and compared three models to try and predict the popular vote for candidates from the incumbent party. The models each use a different measure of the economy to predict popular vote: GDP, RDI, and Unemployment. For each economic measure, I chose to use the Q2 data for each election year because that is the most recent data that is available to test these models using 2020 data. I’m also only looking at elections between 1960 and 2016 because of missing economic data from years before then.
Looking at the GDP model, there appears to be a general positive trend where an increase in election year Q2 GDP growth leads to an increased popular vote percentage. However, all three models have low \(R^2\) values (below 0.30) and wide confidence intervals in regards to predicted popular vote by an increase in GDP growth. When using the 2020 Q2 GDP growth to test these models, we can see just how much the predictions vary and how models based solely on economic variables are susceptible to extreme outliers:
Last time I checked, a candidate can’t win -17% of the popular vote nor 125% of it. So, to try and narrow these wide confidence intervals and improve these models, I will be adding in incumbency as a predictor.
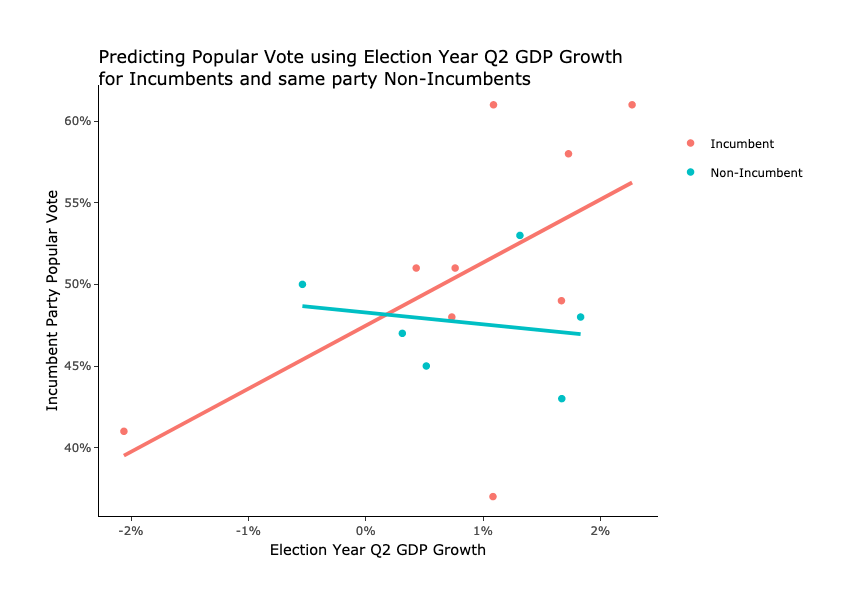
Economic Variables and Incumbency
In the previous blog post, I noticed that incumbent candidates who won the election tended to win a greater percent of the popular vote in general compared to challengers who won. Using that knowledge, I am going to add incumbency as a predictor to the three economic models I just made and see if incumbents are more likely to be rewarded or punished by the economy.
Looking at the same GDP model but with incumbency added, we can see another positive trend for election year Q2 GDP and popular vote won by incumbents. On the other hand, non-incumbents seems to have a slight negative trend with the same economic predictor. So, this provides some initial evidence that supports the idea that incumbents are more likely to be rewarded or punished by the economy. However, the \(R^2\) values for all three models are still low and we can see that there are still outliers like George H.W. Bush in 1992.
As a result, applying these models to the 2020 data yields very similar results as the models without incumbent as a predictor. So, these models still aren’t perfect and are also greatly affected by outliers.
Local Unemployment Data
Shifting away from the national models I made, I also want to look at a local (state-level) economic variable in predicting two-party popular vote. Ideally, I want to look at the same variables as I did for my national models, but unemployment data is the only one of the three economic variables that has 2020 data released at the state level.
So, I have selected a few key “battleground states” that I pointed out in the previous blog post and then I added two more states that are of interest to many analysts:
The results are not too interesting, as the trends between two party popular vote for incumbents and state-level unemployment percent seeming to be flat for most states. Georgia is the only state where the state-level unemployment percent might be a good predictor for two party popular vote for an incumbent candidate. However, further analysis will need to be done and we should still be careful as there are only 7 past elections in the data.
So, I’ve learned that election prediction models built using only economic predictors are not very good models because they have wide margins and are susceptible to outliers. Especially in predicting the 2020 election, we must be careful when extrapolating previous election prediction models because the COVID-19 pandemic has shifted many variables towards extreme outliers such as measures of the economy.