This blog is part of a series related to Gov 1347: Election Analytics, a course at Harvard University taught by Professor Ryan D. Enos.
This week, I’m looking at shocks and how they affect elections. 2020 has been full of shocks, from the COVID-19 pandemic to the death of Justice Ruth Bader Ginsburg. In this blog, I’ll look at and discuss the effect of the COVID-19 virus on the 2020 presidential election. I’ll also be creating an updated state prediction model with the most up-to-date polls.
COVID-19
COVID-19 in the United States has inflected almost 10 million people and killed nearly a quarter of a million people, even infecting the President at one point. Just yesterday, we reached a new record number of daily confirmed cases since the beginning of the virus at over 85,000 positive results. So, it is no surprise that this virus has been a shock to the 2020 election. But, just how we quantify and measure its effect on President Trump’s re-election campaign is a difficult question to answer.
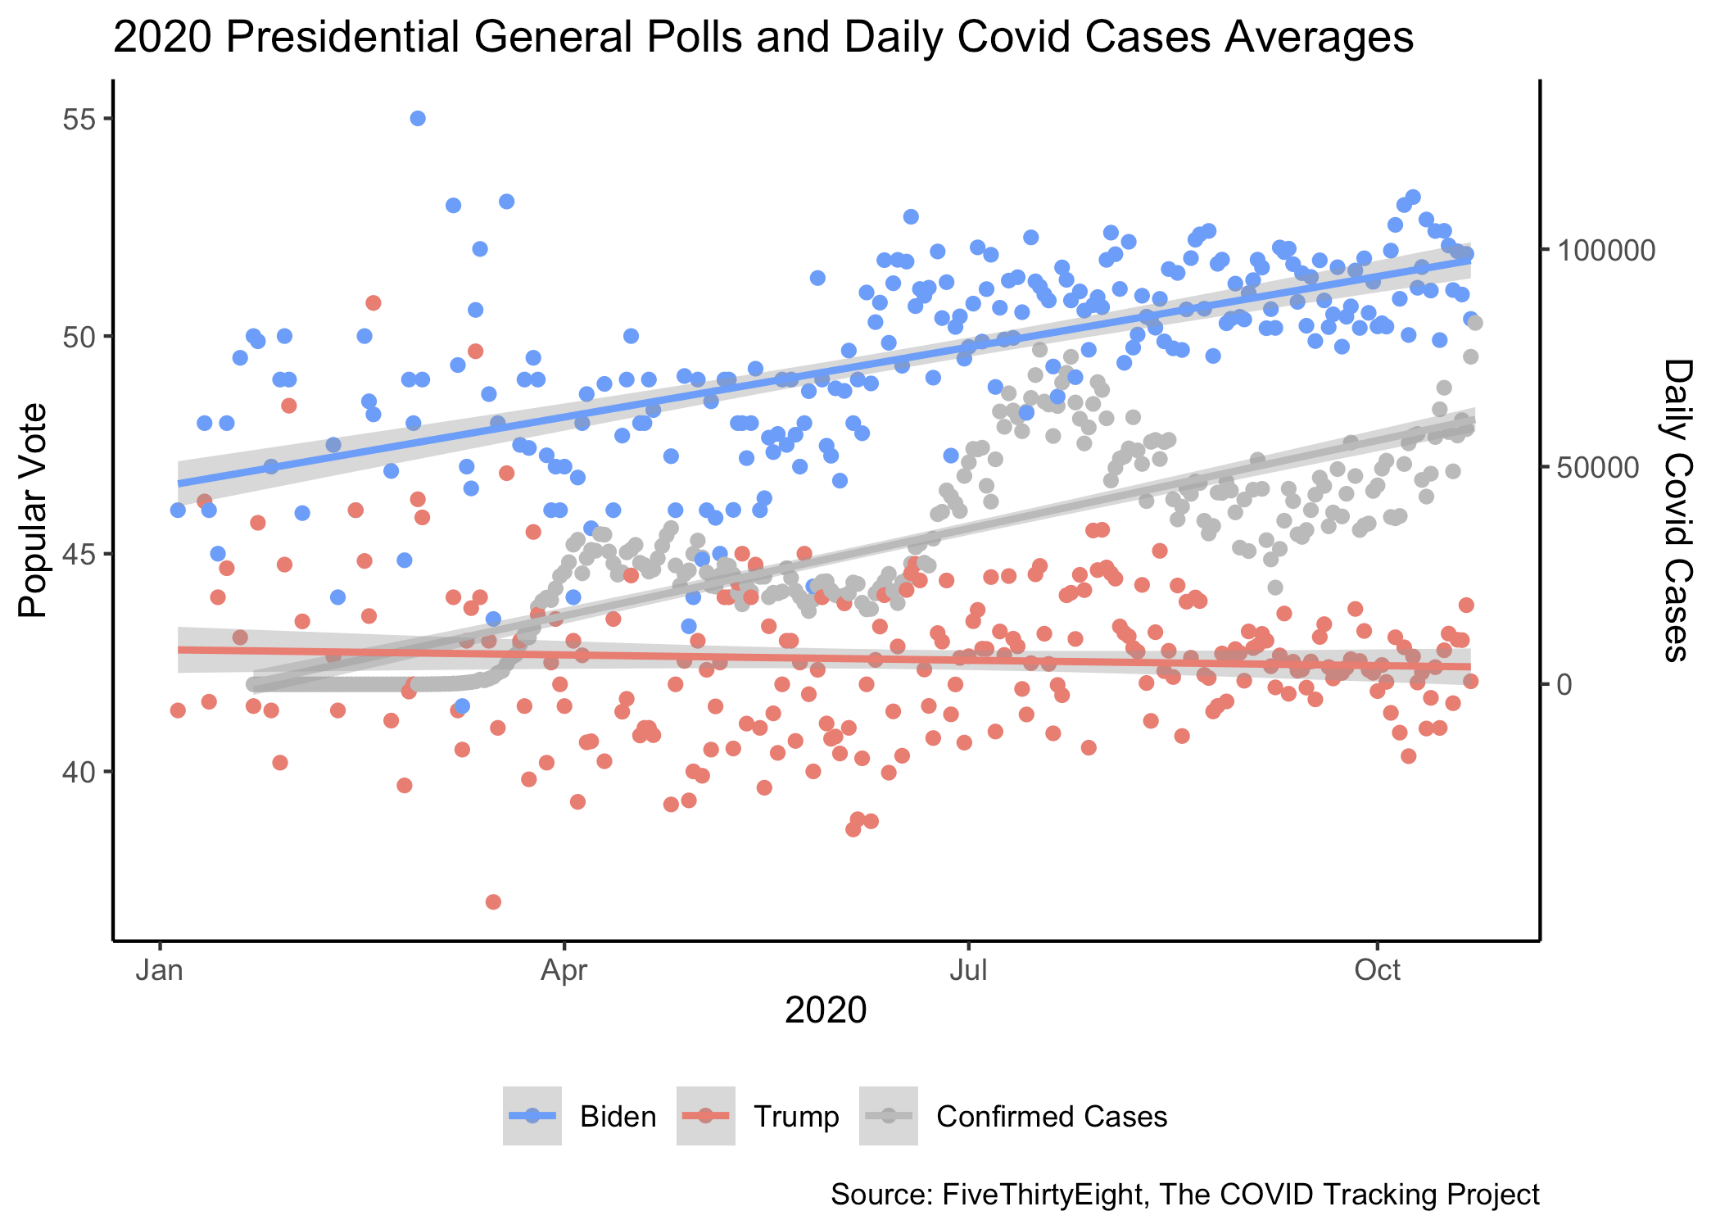
The first thing I did was to try and visualize the effect that the newly confirmed cases might have had on the national election polls:
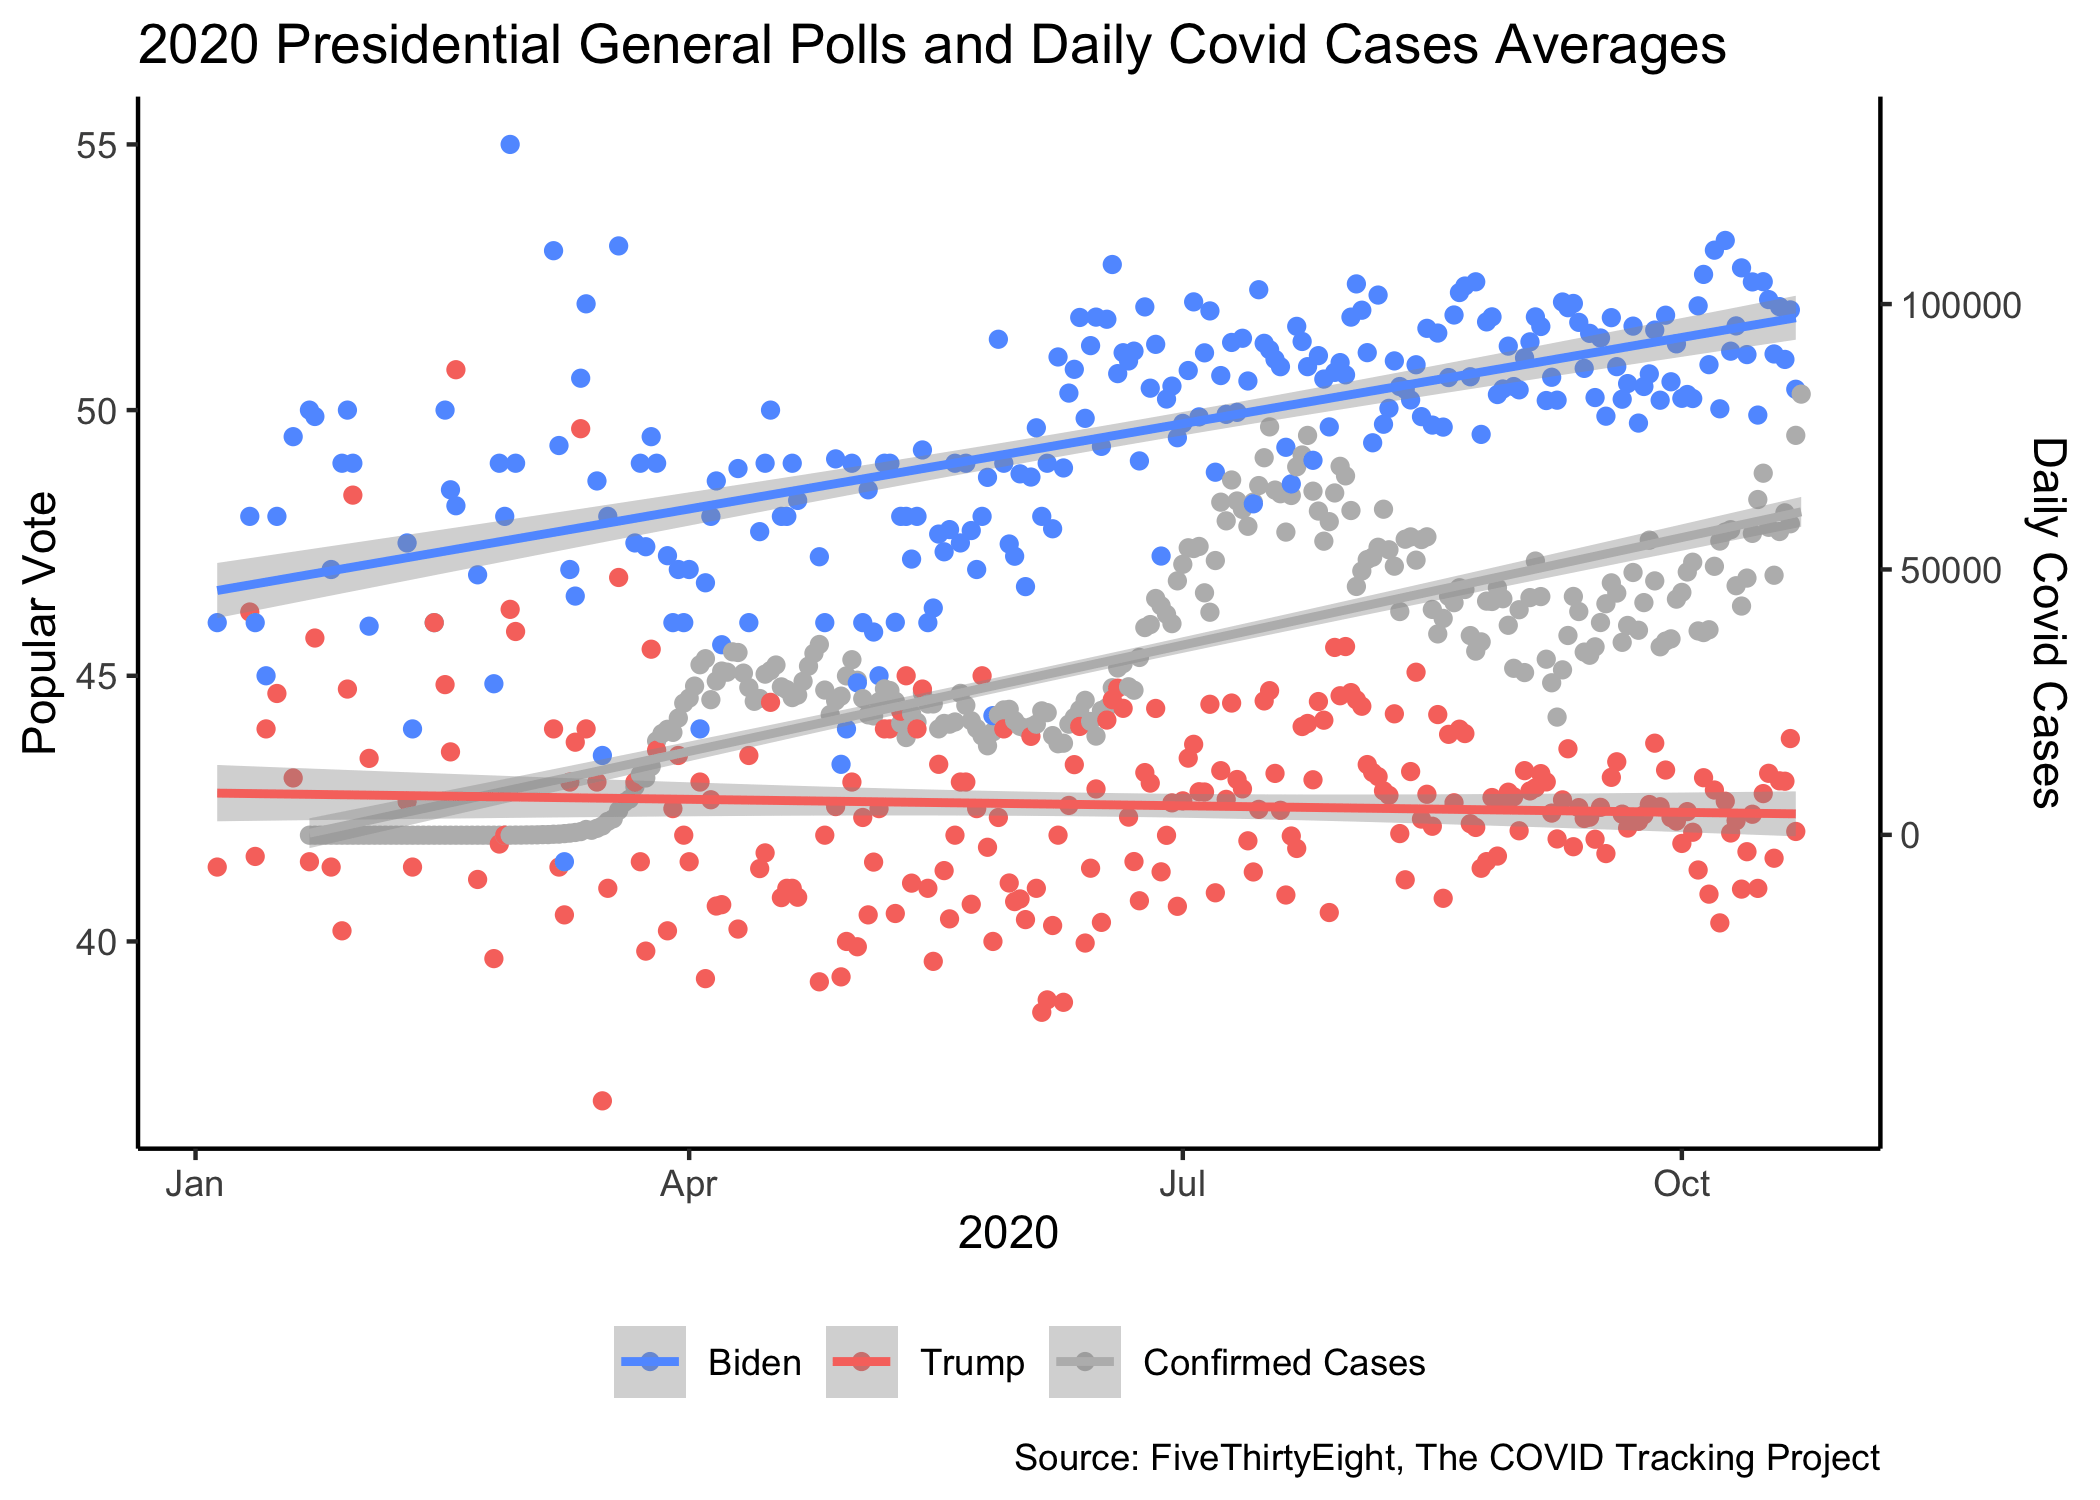
My prior prediction was that as the trend of cases went up, Trump’s popular vote poll would drop because Americans would blame his administration for the increase. However, this doesn’t seem to be the case. Instead, as daily cases increased, Biden’s popular vote has increased a lot more than Trump’s popular vote has decreased. Note that I scaled the growth of daily COVID-19 cases to fit on this graph alongside popular vote. So, the purpose of the COVID-19 trendline is just to show its growth.
The next thought I had was to look at President Trump’s approval ratings. I wanted to see if his approval ratings would also stay relatively steady as his popular vote share does:
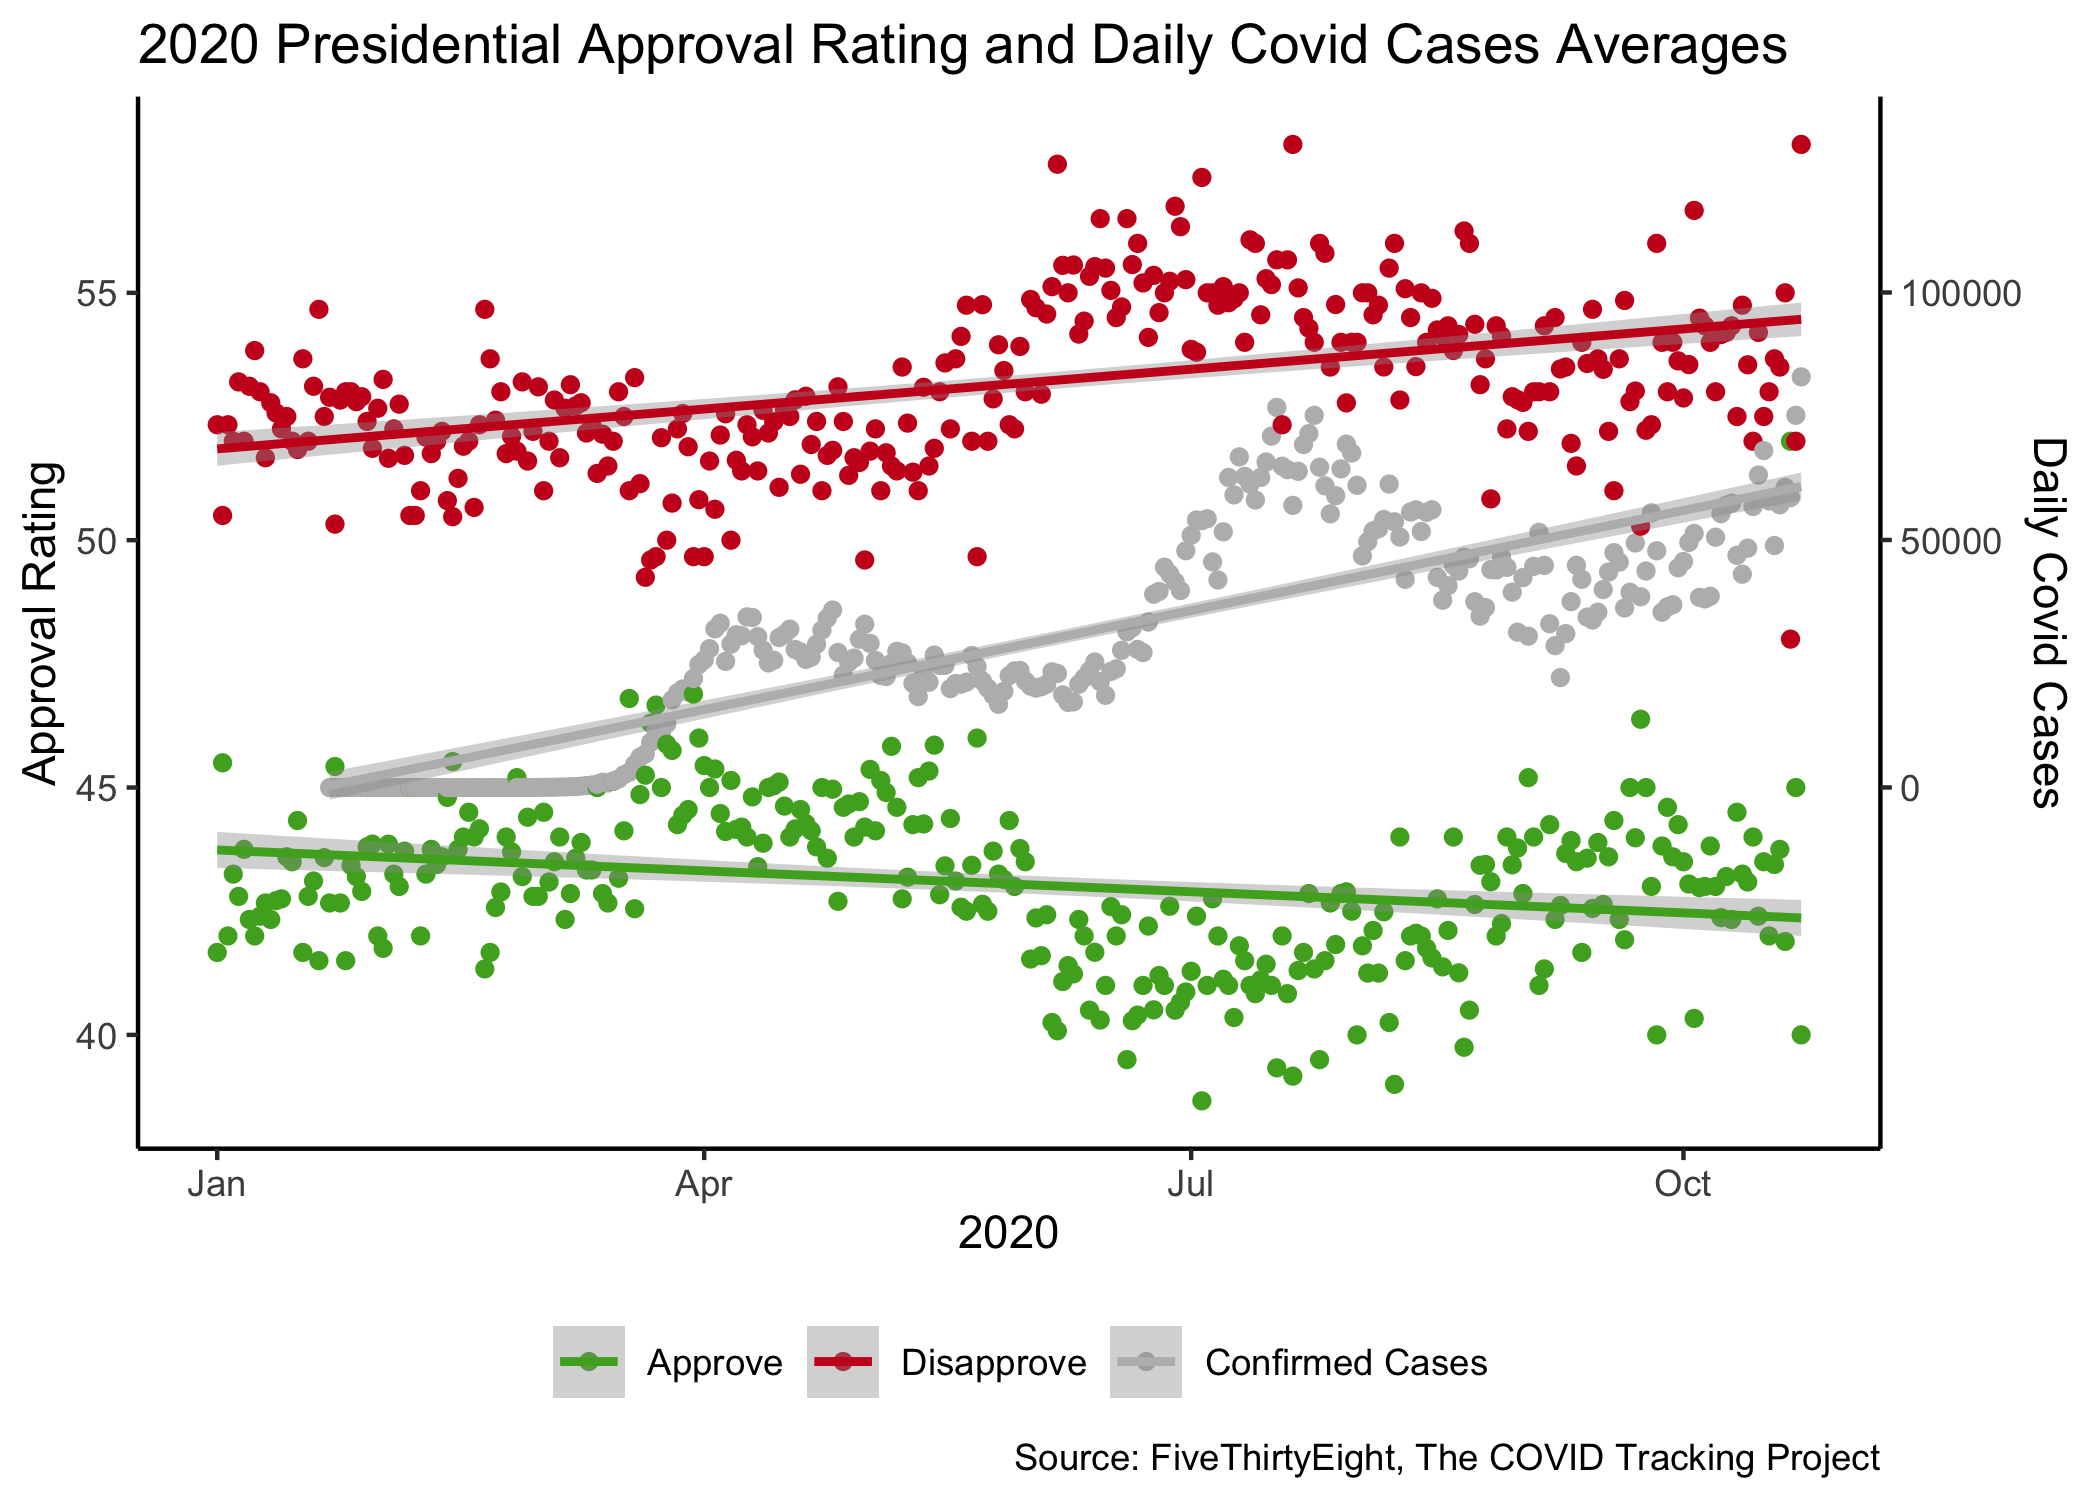
The results appear to be consistent. Just like his popular vote share, he’s only seen a slight decrease in approval and a slight increase in disapproval. This is surprising given that you’d expect more voters to be disapproving of the President’s handling of the COVID-19 virus. This could mean that most of Trump’s base will stick with him in the 2020 election, although we will have to wait to see if that’s true.
State Prediction Model
Updating my state prediction model this week, I am using the same predictors as I used in my incumebncy blog post: average national poll, incumbency, Gallup job approval ratings, and the interaction between incumbency and Gallup job approval ratings to try and predict two-party popular vote. The only difference is that these models use state-level poll data (from 1972 to 2016) and I’m using LOOCV to measure the effectiveness of my models. The overall predictions made by my model on the historical data are plotted here:
Average poll is an average of state polls 22 weeks or closer to Election Day (about the start of June). Job Approval is an average of the Gallup job approval ratings from June 1 to Election Day. I chose to exclude polls outside this range because of evidence that polls get better as they approach Election Day and to keep this consistent throughout my blogs.
Overall, my models for each state do a fairly decent job of predicting the results of past elections. Of every state election from 1972 to 2016, this model correctly predicted 88% of them. The states that it performed the most poorly on were Colorado, Nevada, and Ohio. The state model RMSEs range from 2 to 9 with a median of about 5 and a median R-Squared of 0.57.
Interestingly, the model incorrectly predicted the 2016 results of Colorado, Iowa, Michigan, Nevada, Pennsylvania, and Wisconsin (all within a 2-point margin of error). This is interesting because these incorrect predictions gave an electoral college tie between Clinton and Trump.
2020 Prediction
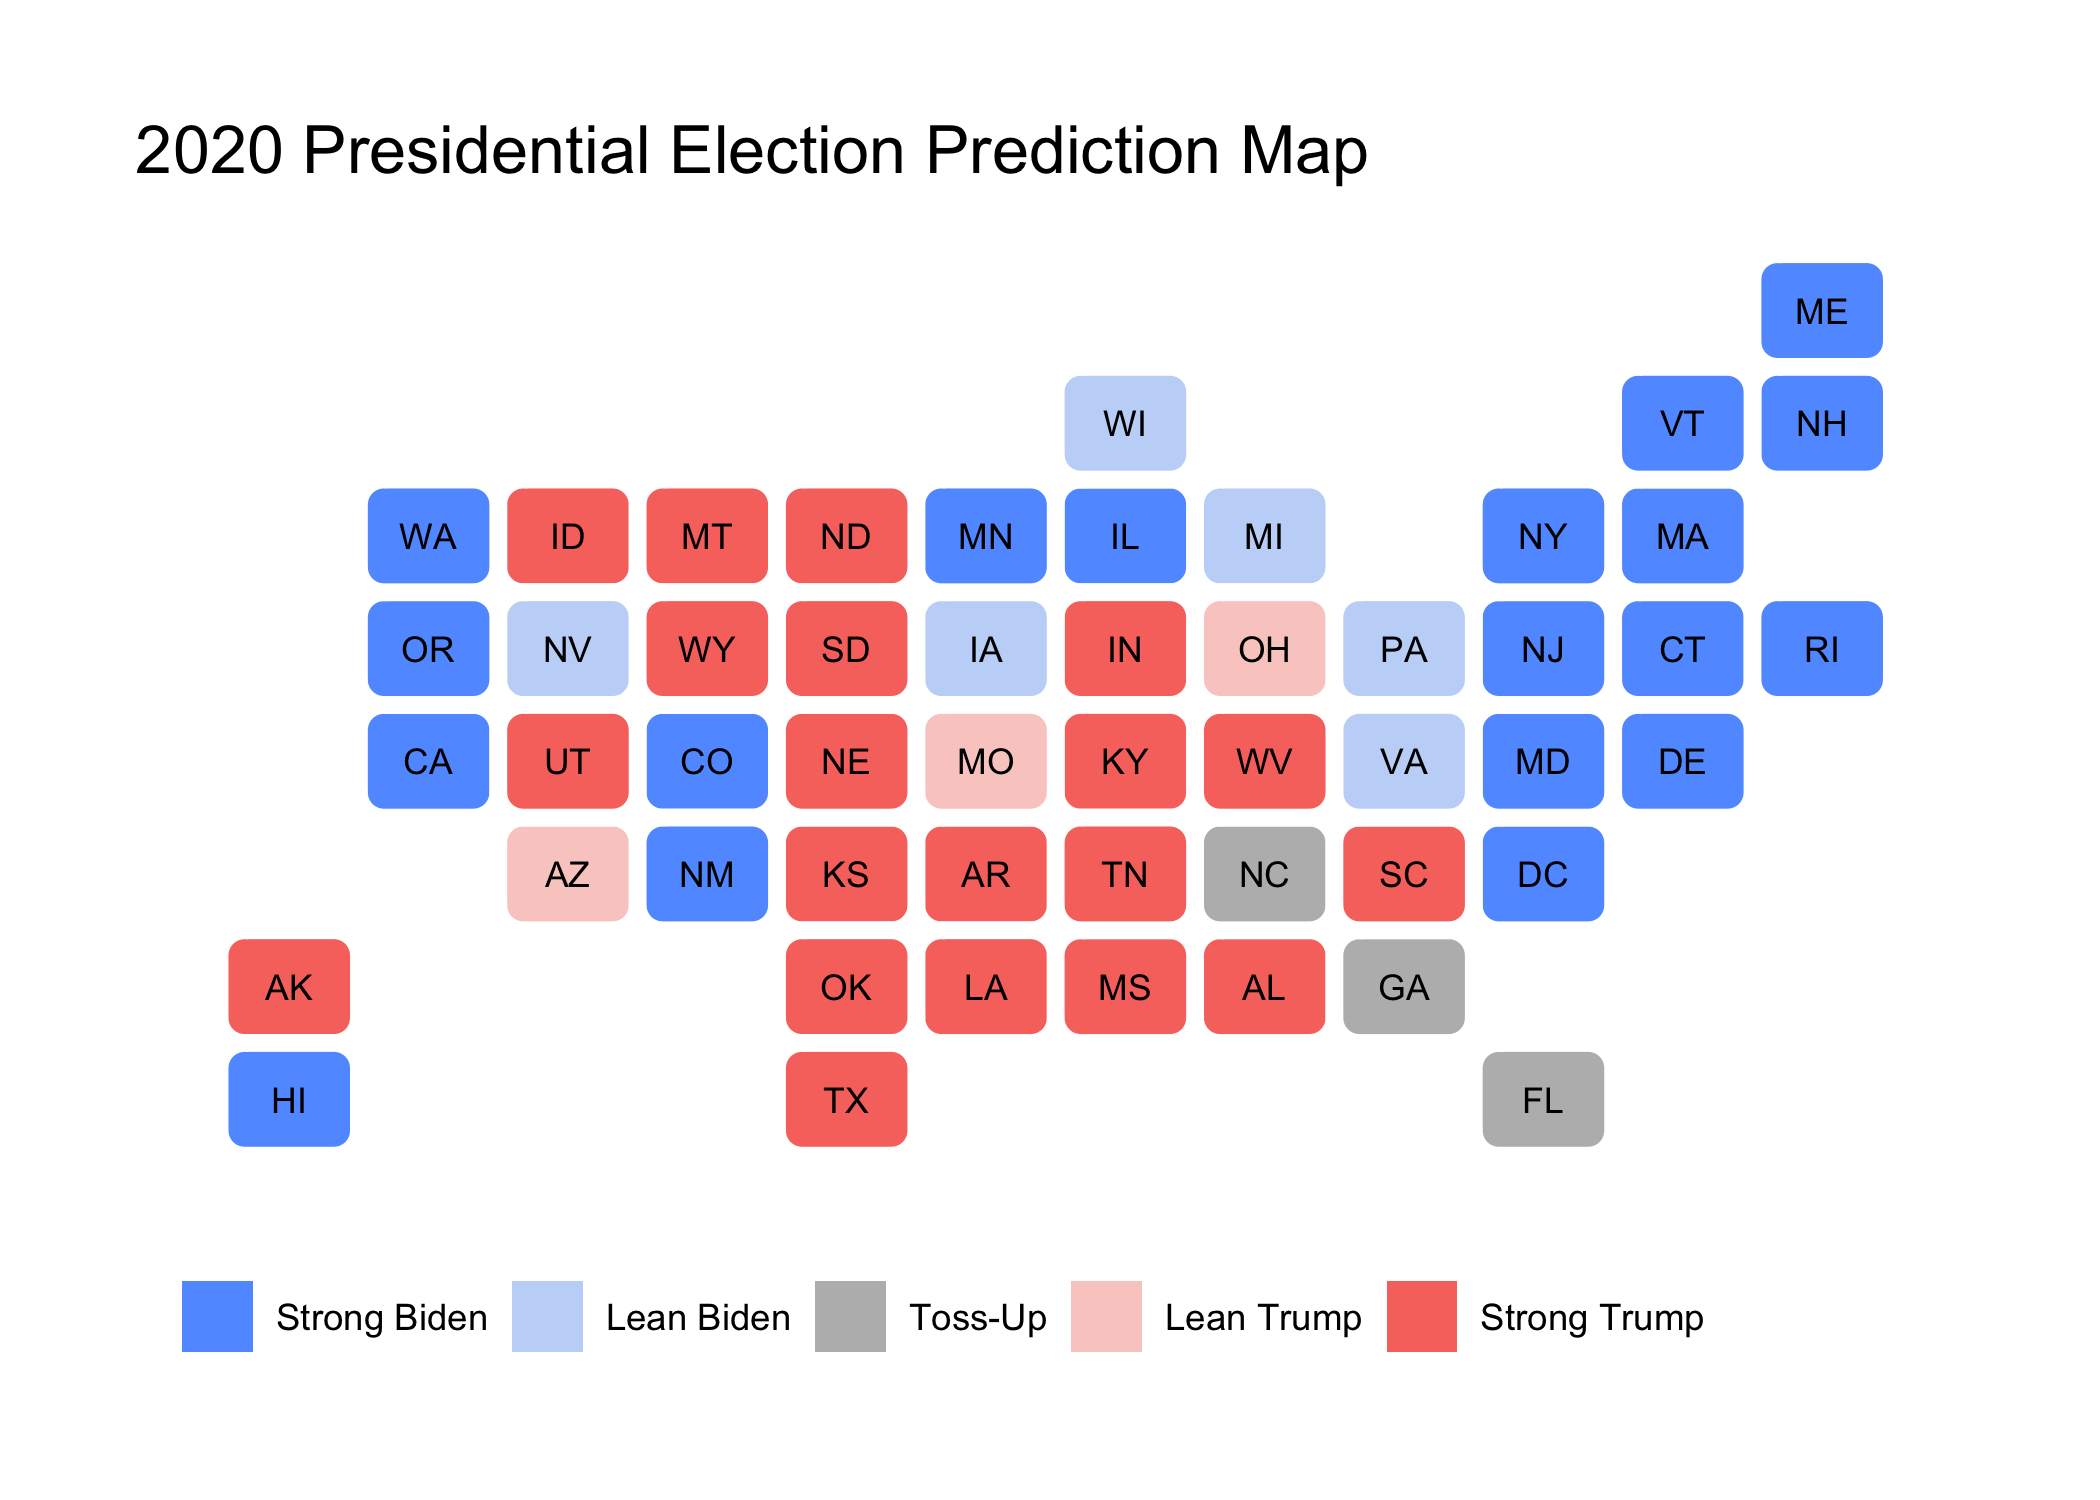

Strong Predictions have a 5% or greater win margin, Lean Predictions are between 2% and 5%, and Toss-Ups are predictions within 2%
For the 2020 election, this model gives Biden the victory with 301 Electoral Points (212 strong points and 89 lean points). The three states that are still a toss-up are North Carolina, Georgia, and Florida. It will be difficult for President Trump to still win given that he’ll need to take all three of the toss-up states and steal a few states that lean Biden all while maintaining all the states that he’s projected to win.
For my final prediction model, I will simulate scenarios with these models to gain a better sense of the uncertainty.
COVID-19 Effect?
Going back to the original question about quantifying the effect that COVID-19 has had on the 2020 election - it is tough to exactly pinpoint its effect. There are also many other questions about this year’s election that is tough to evaluate: How will the big shift to mail-in voting affect the election? How long will it take for the final election results to come out since so many mail-in ballots have to be counted? This is a strange year for everyone, and especially a strange year to try and predict and election.