This blog is part of a series related to Gov 1347: Election Analytics, a course at Harvard University taught by Professor Ryan D. Enos.
This week, I am looking at incumbency and the unique position that incumbents have in presidential elections. I’ll start off by evaluating some of the advantages that incumbents have and then build a few models that use incumbency. At the end, I compare my models to the Time For Change Model and then make predictions for the 2020 election.
Incumbent Advantages
“Incumbency Advantage” is one of those terms that always gets thrown around on TV networks during election years and you might even vaguely remember reading about it in your high school civics textbook. But, what does “incumbency advantage” actually mean? Is it just the fact that being an incumbent makes voters more likely to vote for you? Well, yes and no.
The “incumbent” label on a ballot might not solely persuade voters to vote for one candidate over another. However, the power of the presidency, specifically federal spending, does show evidence of giving the incumbent candidate an advantage over his or her opponent.
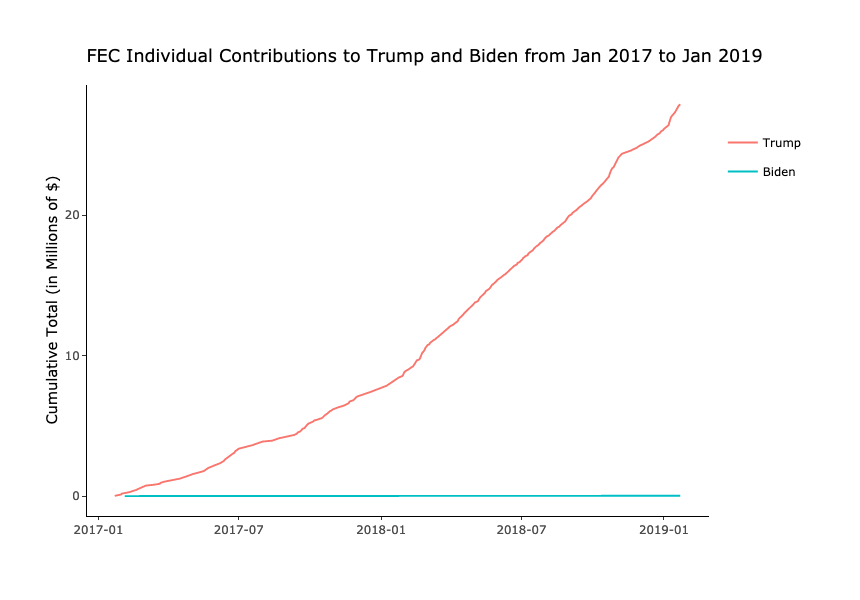
Another area where incumbents have an advantage is in campaign finance. Historically, most incumbents have been backed by their parties during their re-election. So, most incumbents don’t need to worry about having to win a primary first before tackling the general. The current President, Donald Trump, even started his re-election campaign on the day of inauguration. This gave him a huge early advantage in terms of receiving donations before his opponent:
During the first two years of Trump’s presidency, as shown in the graph, he raised almost $30 million towards his re-election while Trump’s opponent, Joe Biden, barely scratched the surface. While Trump’s re-election campaign might not have been able to sustain that financial lead forever, it can still be counted as an example of incumbency advantage. The data for individual contributions come from the Federal Election Commission.
Models Using Incumbency
Now that we can see some of the benefits that incumbents have, how can we incorporate incumbency into our 2020 election prediction models? I already had a glimpse of how incumbency can change models in a previous blog post, so I’m going to do the same thing of adding in incumbency as a predictor.
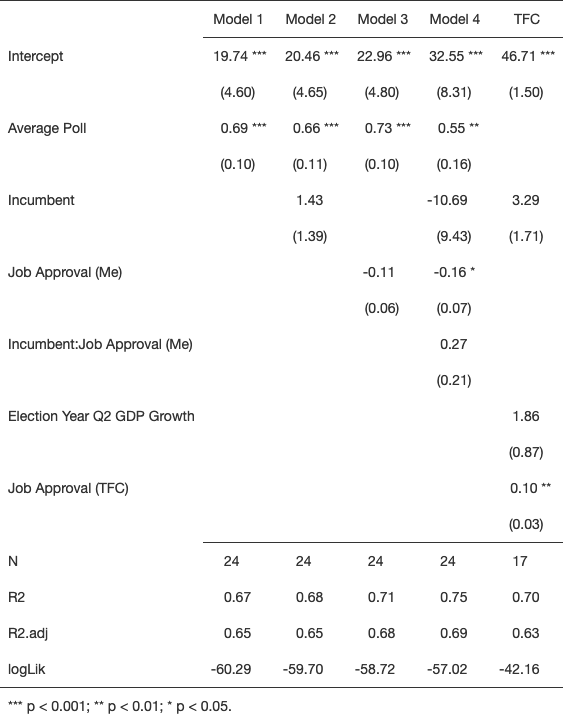
In the four models I create below, I chose to include a mix of the following predictors: average national poll, incumbency, Gallup job approval ratings, and the interaction between incumbency and Gallup job approval ratings to try and predict two-party popular vote. My models used election data from every presidential election from 1968 to 2012. After creating four models based on these predictors, I compare my four models with the Time For Change model created by Alan Abramowitz. The Time For Change model evaluated data on incumbent party candidates from 1948 to 2012. I chose to leave out data from 2016 to test some of these models using leave-one-out validation at the end. I also chose to exclude any GDP data given my previous analysis of it being a poor predictor in 2020 due to the COVID-19 pandemic.
Average poll is an average of national polls 22 weeks or closer to Election Day. Job Approval is an average of the Gallup job approval ratings from June 1 to Election Day. I chose to exclude polls outside this range because of evidence that polls get better as they approach Election Day and to keep this consistent throughout my blogs.
Evaluating the effectiveness of my models, we can see that Model 4, which used all predictors and the interaction term, had the highest R-Squared and Adjusted R-Squared values of 0.75 and 0.69. However, the Time For Change model did not do poorly either, with a R-Squared value of 0.70 and Adjusted R-Squared of 0.63.
In further analysis, leave-one-out validation using the 2016 election, of these two models, the Time For Change model correctly predicted Hillary Clinton’s loss against Donald Trump by giving her a two-party popular vote of 48.3%. However, Clinton actually won the popular vote in 2016 with 51.2% of the two-party popular vote. So, my Model 4 did better than the Time For Change model in terms of evaluating the popular vote by predicting a two-party popular vote of 51.3% for Clinton (after scaling to a 100% total). Looking at a graph comparing the actual and predicted two-party popular vote of past Presidents, we can see that this model does pretty well:
But to see the major differences between Model 4 and the Time For Change model, I evaluate the regression coefficients and their distributions:
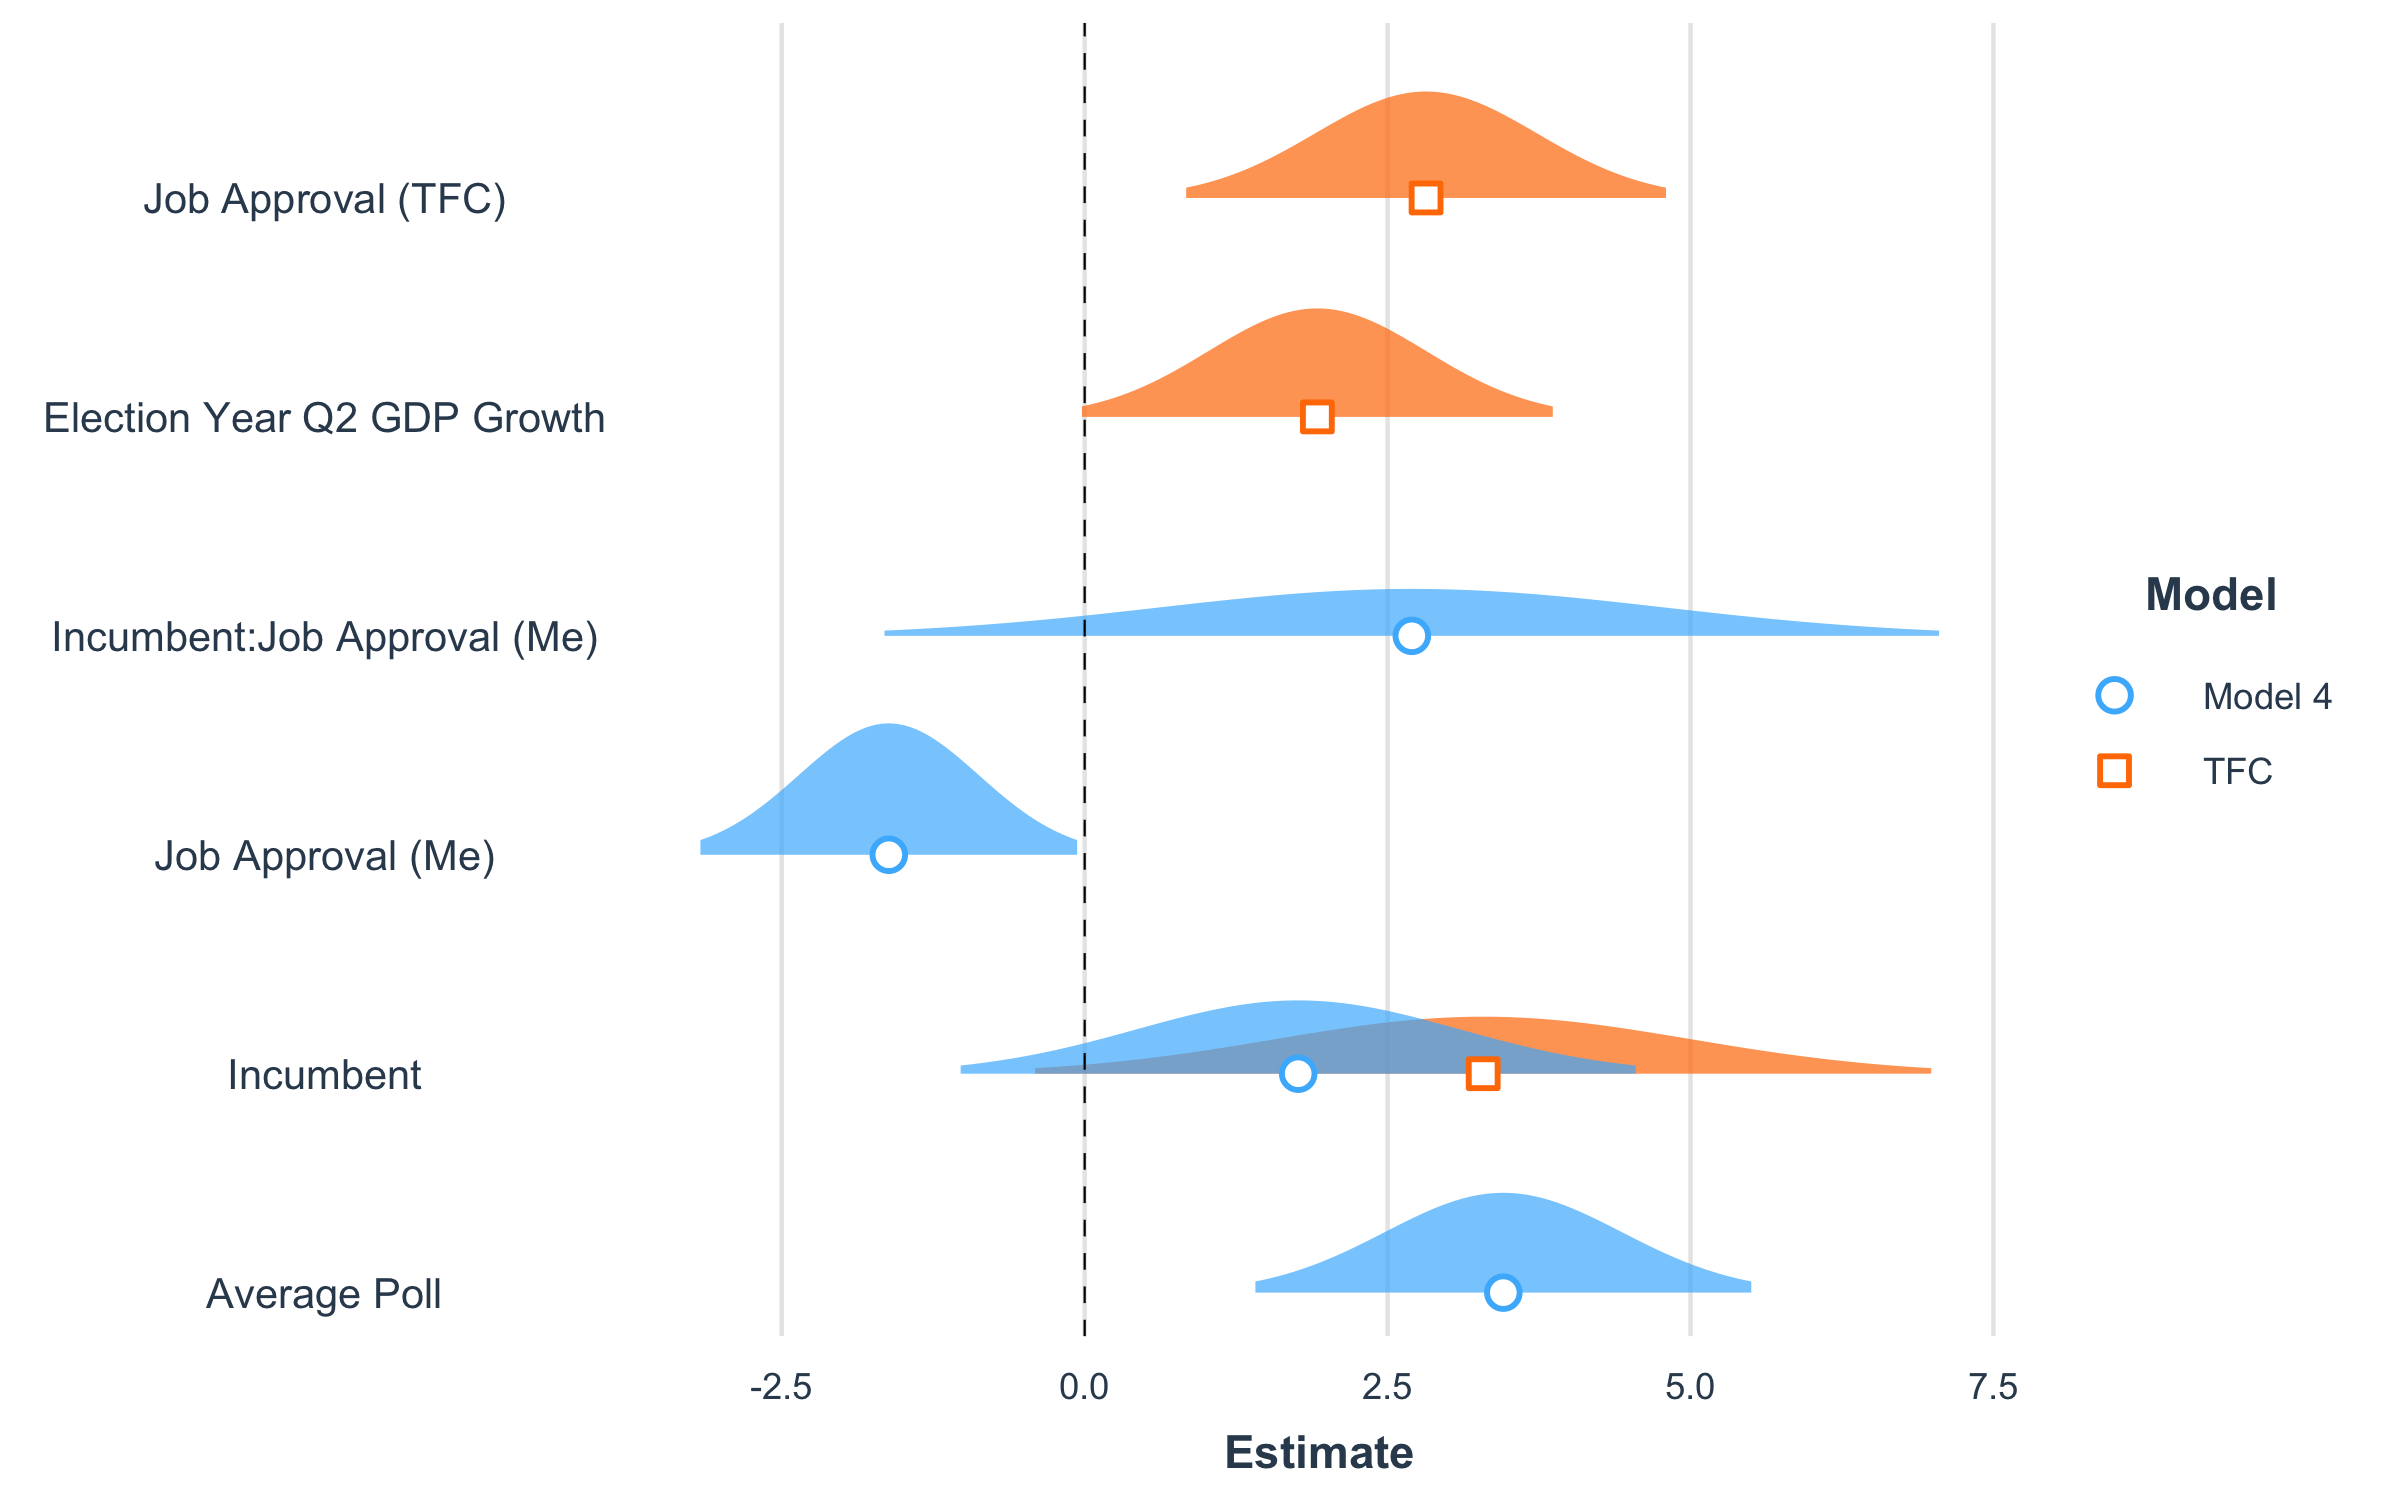
The key difference lies in how incumbency affects each model. We can see that the Time For Change model gives incumbency a higher coefficient and a wider distribution because it does not use an interaction between Gallup job approval and incumbency. My Model 4 looks at this interaction and changes the effect of job approval ratings for incumbents compared to challengers. I think this makes sense, given that higher job approval ratings should benefit the incumbent more than the challenger. This is also my attempt at slightly evaluating incumbency more than just looking at the general label of “incumbent”.
2020 Prediction
My Model 4 predicts a 52.5% two-party popular vote win for Biden (after scaling to a 100% total). The Time For Change model predicts that Biden will have a blow-out victory with 69.1% two-party popular vote win. The unusually high prediction of the Time For Change model is exactly why I chose to leave out GDP data in my models. My previous analysis of GDP data in presidential election models found it to have wide margins and highly susceptible to outliers, such as the one caused by COVID-19 used in the Time For Change model.