This blog is part of a series related to Gov 1347: Election Analytics, a course at Harvard University taught by Professor Ryan D. Enos.
It is now almost two weeks and a half past election day 2020. Joe Biden is the president-elect, however President Trump will not concede and is instead contesting the election. It is unlikely that the results of the election will be changing, as there does not appear to be any solid evidence of widespread voter fraud. So, I will be going ahead with my post-election analysis and reflection. I’ll specifically be exploring how my models performed and try to brainstorm what caused any errors in my models. At the end, I will address some things I think would be useful to explore in forecasting future election.
National Two-Party Popular Vote
The first model I created in my final prediction predicted the national two-party popular vote. A summary of the model predictors: polling averages, the two-party popular vote from the previous election, incumbency, presidential job approval, an interaction between incumbency and presidential job approval, and party using data from 1968 to 2016. The final prediction for 2020 using this model was about 51.8% for Biden and 48.2% for Trump. This is pretty much exactly what the actual two-party popular vote of about 52% for Biden and 48% for Trump turned out to be. Keep in mind that the actual final count is still being tallied, but the final percentage shouldn’t shift drastically. Overall, this model did a fantastic job of forecasting the two-party popular vote. You can see the 2020 prediction in red on the plot below alongside the blue dots showing the training predictions.
For this model, I think the extremely small error of 0.2 can be attributed to natural real-world variation. So, I would not change anything about this model. If the final count changes the two-party popular vote drastically, I will write another blog to re-evaluate the model. However, I don’t think that the percentage will change drastically as most states only have a few more counties waiting to report.
I wasn’t too surprised that this model did well because it did similarly well when I was training it to predict the 2016 two-party popular vote. However, an interesting observation from this is that it appears most Trump voters stuck with him and did not shift over to vote for Biden.
State Two-Party Popular Vote and Electoral College
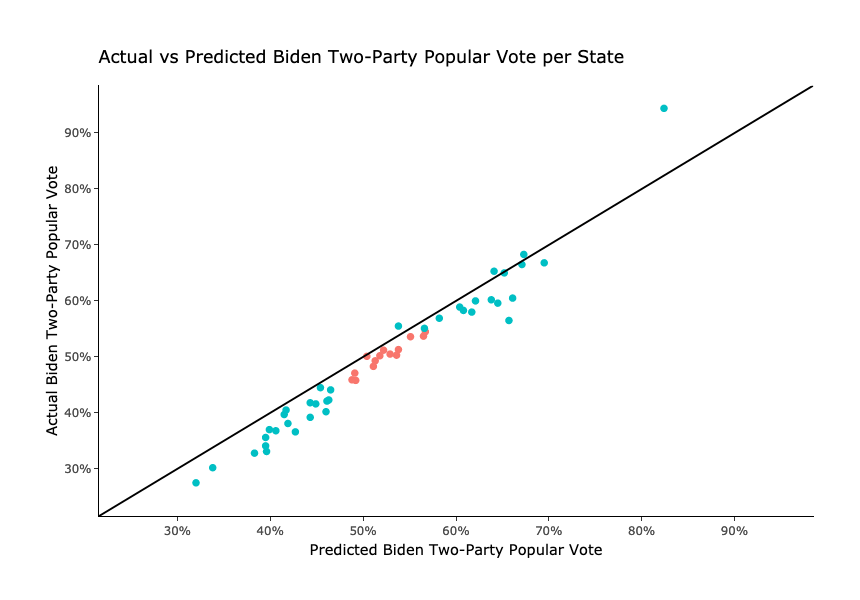
The state model is where I think the results are more interesting. I used the same predictors as in the national model except for the previous election two-party popular vote. I also used the voter eligible population and number of state votes in past elections to create binomial logistic regression models that predicted the number of votes instead of the two-party popular vote per state. However, to make the results easy to interpret, I calculated the two-party popular vote using the number of predicted votes for both Biden and Trump per state. I started by pulling out only the predictions for Biden in each state and plotting the actual two-party popular vote for Biden against my predictions below:
The initial reactions I had to this plot were that either the model generally overpredicted Biden’s vote share or not all the Biden votes were counted yet. However, as days went on and more votes were reported, I leaned more towards the former than the latter. My models did overpredict Biden’s 2020 vote share in almost every state. Calculating the root mean squared error of all my state predictions, I get about 3.86 percentage points. This is not bad, but you can see that some states and D.C. were off by over 10 points. I know that some of these “safe” states for Biden and Trump had much fewer polling due to the much smaller possibility of them flipping. So, just looking at the “battleground” red points, where Biden either won or lost by less than 10 points and where there was much more polling, the root mean squared error decreases a fair amount to only 2.33 percentage points.
That being said, assuming that each state has a winner take all electoral system (which most of them do), this model still correctly forecasted 49 out of the 50 states + D.C. The two states I missed were Florida and North Carolina. This shows very similar results to the popular FiveThirtyEight and Economist models as their models also missed these two. My overall electoral college forecast was 343 for Biden and 195 for Trump. This was only 37 points off, which can be mainly attributed to Florida and North Carolina.
While the electoral college predictions may have been almost perfect, I think the models could have been even better. Continuing to focus in on the points in red, where Biden won or lost by less than 10 percentage points, you can see that every single forecast over-predicted Biden’s vote share, up to almost 5 percentage points!
Interestingly, these over-predictions seem to align closely with the overall disappointment among many Democrats who thought that this election would be a referendum on President Trump. This was not the blowout victory that they were expecting, and much closer than many expected.
What Went Wrong?
So, what went wrong? I think the overall forecast was solid. 49 out of 51 states predicted correctly is not bad at all. However, I do believe that the widespread over-predictions for Biden is a major issue. Thinking ahead to the 2022 and 2024 elections, I am concerned that forecasts will continue to over-estimate the democratic vote share. This could potentially lead to dangerous over-confidence among democratic candidates. So, this section will be centered around answering the question why did so many polls over-estimate Biden’s vote share and how can we prevent this in the future?
My main hypothesis, along with many others such as Nate Cohn from the Times is that the polls have continued to worsen since 2016. Cohn compares the 2020 polls to the 2016 ones and notes that even weighing heavily for education was not enough in 2020 when it came to evaluating attitudes of white voters without a degree. He also notes failures to capture the attitudes of senior voters, who Biden was supposedly doing much better among than Clinton. The results were much closer than expected. However, trying to capture the direct reasons that polls were off in 2020 is much more difficult than it was four years ago. This election had a record-breaking turnout rate, it was conducted in the middle of a global pandemic, and President Trump had broken almost all norms in politics since his election. Another article in the Times also points out that non-response bias, especially among Republicans, has only grown and continues to grow, making it more and more difficult to accurately evaluate the attitudes of voters.
Looking back at why my specific models over-predicted Biden overall, I found that it was mainly caused by heavy reliance on the inaccurate polls. Because polling is the most weighted variable in my models, even having them off by a few points causes a drastic shift in my models. You can see the heavy dependence on polls in my model by comparing this plot below showing actual two-party popular vote vs average poll and the plot I created above.
At first glance, the plots appear to be nearly identical to one another. But there are differences (in the correct direction) thanks to the other predictors I used. A closer comparison showed that my predictions, both among all states and close battleground states, were much closer to the actual vote share than just the average polling alone. This can be seen in the mse and rmse values I calculated and present in the table below (lower is better):
So, I think that an over-dependence on polling led my models to over-predict Biden’s vote share (even though my other predictors did a better job to pull the predictions closer to the eventual truth). This is especially true in states where there were very few polls or bad quality polls, such as in D.C. where my prediction was off by more than 10%! That being said, as I’ve mentioned before, since the U.S. uses an electoral college system and there was no evidence of states like D.C. to flip, I was not focused on pinpointing the exact two-party vote share of those states.
What should I change?
Being the first election forecast of mine, I am satisfied with the final results. But, there are many things that I could have done better and could do better for future elections in 2022 or 2024 and beyond. First, I need to put less weight on polling either manually or through other predictors. One of my main goals post-election is to figure out how to put less weight on polls because of how much polls over-estimated Biden’s vote share. I also fear that polls will not improve as Trump continues to refuse to concede and tell his supporters that the election was rigged. All of these concerning results of the 2020 election and the increasing non-response bias among Republicans leads me to try and find a better way of measuring voter attitudes. One way of doing this might be through adding in a measure of excitement for the election or specific parties/candidates. Other possibilities include looking at individual contributions made to each candidate using FEC data or using voting results in the primary elections.
Second, I think weighing recent election results more and older election results less might result in better forecasts. This is more of a hypothesis, but I reached this thought as the number of polls have increased in recent decades and more recent elections might capture current voter attitudes better than older elections.
Third, while I found presidential job approval to be a fantastic replacement in measuring the economy, I wonder if quarterly GDP data will prove to be useful again in future elections (assuming that there is not another big shock to the economy). When training the model using GDP data, I would probably leave 2020 out as it would be an abnormal outlier.
Fourth, trying to gain a serious measurement of different attitudes among minorities is critical to future election forecasts. Being some of the fastest-growing voting blocks, we saw how the lack of information on Hispanic voters in Miami-Dade County led to most if not all models to incorrectly forecast the state of Florida. This was probably the biggest failure of pollsters in 2020, and I expect them to better account for minority voters next time. However, evaluating more historical trends and incorporating demographic data in a county-level model might lead to more accurate forecasts in battleground states.