
This blog is part of a series related to Gov 1347: Election Analytics, a course at Harvard University taught by Professor Ryan D. Enos.
This week, I am looking at the demographic breakdown of individual states. Using the change in demography, I create models for each state predicting two-party popular vote. I then compare these models to a control model that uses polls and incumbency to predict two-party popular vote. I also begin to explore the use of the caret package in this blog, specifically for cross-validation.
Demographic Trends
Most demographic trends in U.S. politics are not difficult to predict and are mentioned frequently by politicians, news correspondents, and journalists:
- Minority voters lean towards the Democratic Party
- More White men lean towards the Republican Party
- Women generally lean towards the Democratic Party
- Religiously unaffiliated voters lean towards the Democratic Party
- …
The Pew Research Center released an informative report about party affiliation among voters in general right around the time of the 2016 Presidential election.
Using these known trends, I focus on trying to quantify their impact on Presidential elections using data on the changing demographic breakdown of states. Specifically, how the increase in the proportion of minority voters in states changes which party a state will go to in the electoral college.
Control Model
I begin by creating control models for each state using average polls and incumbency to predict two-party popular vote for each party. This is based on the model I created in the incumbency blog that performed well at the national level. So, the polls variable is the average of all the state polls conducted 22 weeks or closer to election day and incumbency is either a 0 for no and 1 for yes. These models were validated using 5-fold cross-validation. However, a leave-one-out validation might have been more appropriate given the limited data. I am just using this blog as an example to explore the caret package.
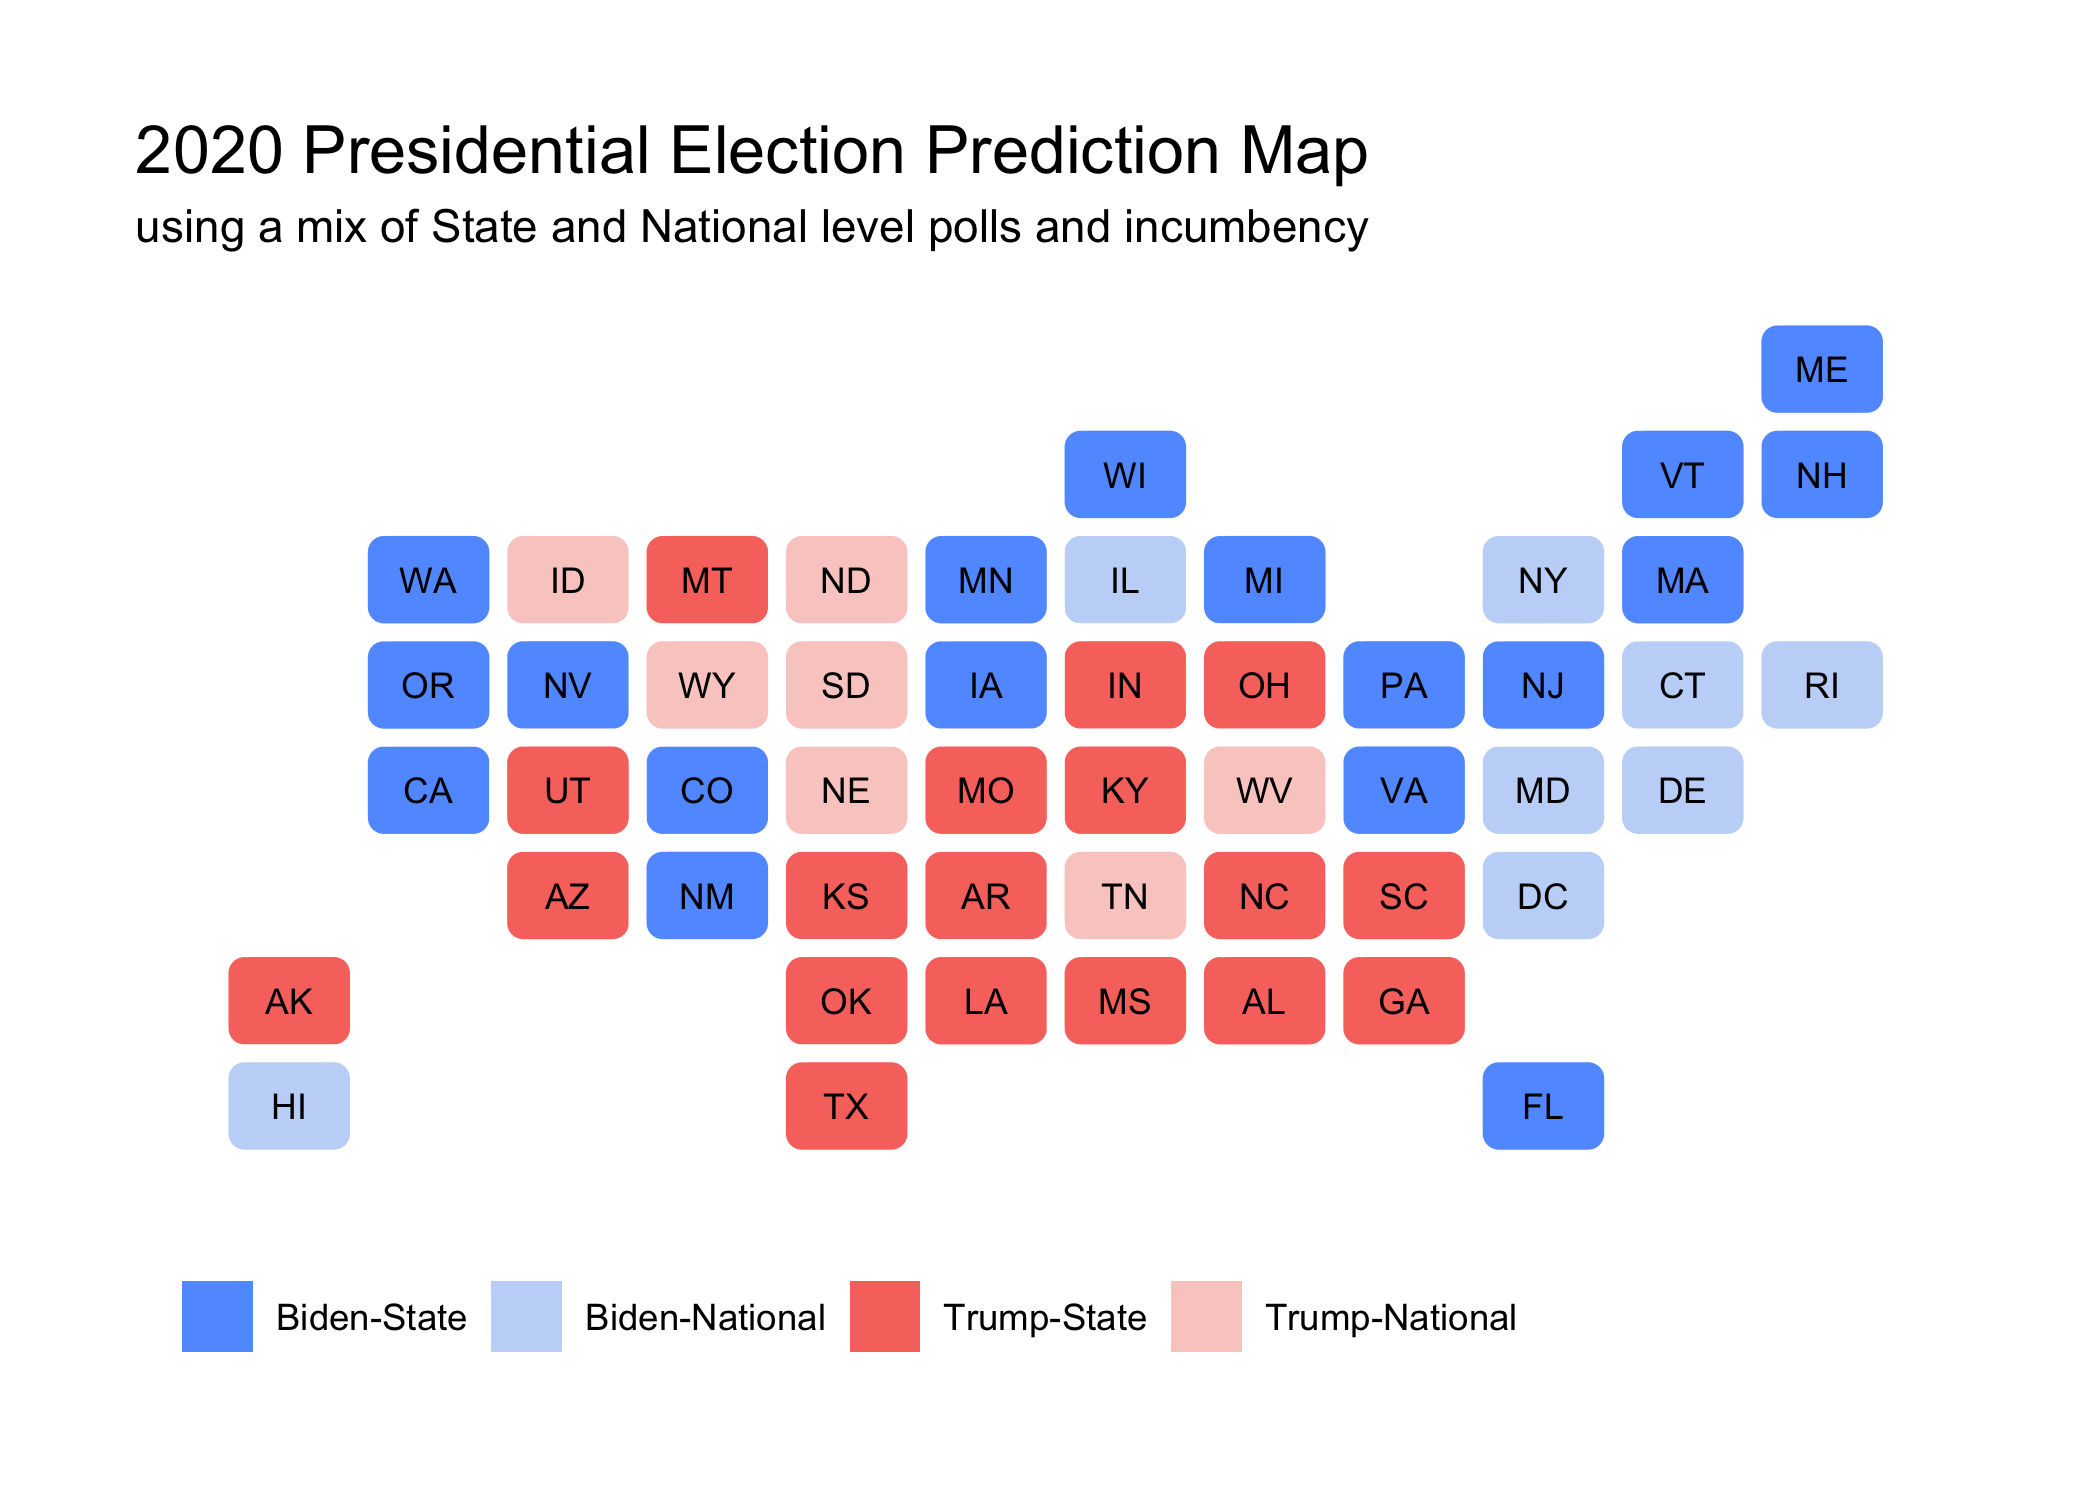

States labeled as Biden-National and Trump-National used an average of the national polls instead of an average of the state polls because there are none available for 2020.
In my attempt to differentiate the state predictions that came from national polls vs state polls, this map doesn’t show the margin of victory that the model predicted for each state. However, the states that had small margins (~less than 3 percentage points) were: Colorado, Florida, Iowa, Nevada, New Hampshire, Ohio, and Virginia. The prediction for Florida was one of the closest and that makes sense since it is one of the states that could go either way in 2020. However, I worry that some state polls, such as the ones for Pennsylvania, are still not accurately counting white voters due to non-response bias or some other factor. This is something that I will have to take into account for my final 2020 prediction model.
Demographic Model
For the demographic models, I used the change in Black, Hispanic, and Asian Voters to try and predict two-party popular vote for each party. These models were also tested using 5-fold cross-validation, noting the same statements I made about the previous model in regards to a small amount of data. This idea is based on the fact that the share of non-Hispanic White voters overall has been on the decline since 1984. Given the demographic trends I mentioned earlier, this could flip some states completely from being a historically Republican state to a Democratic state.
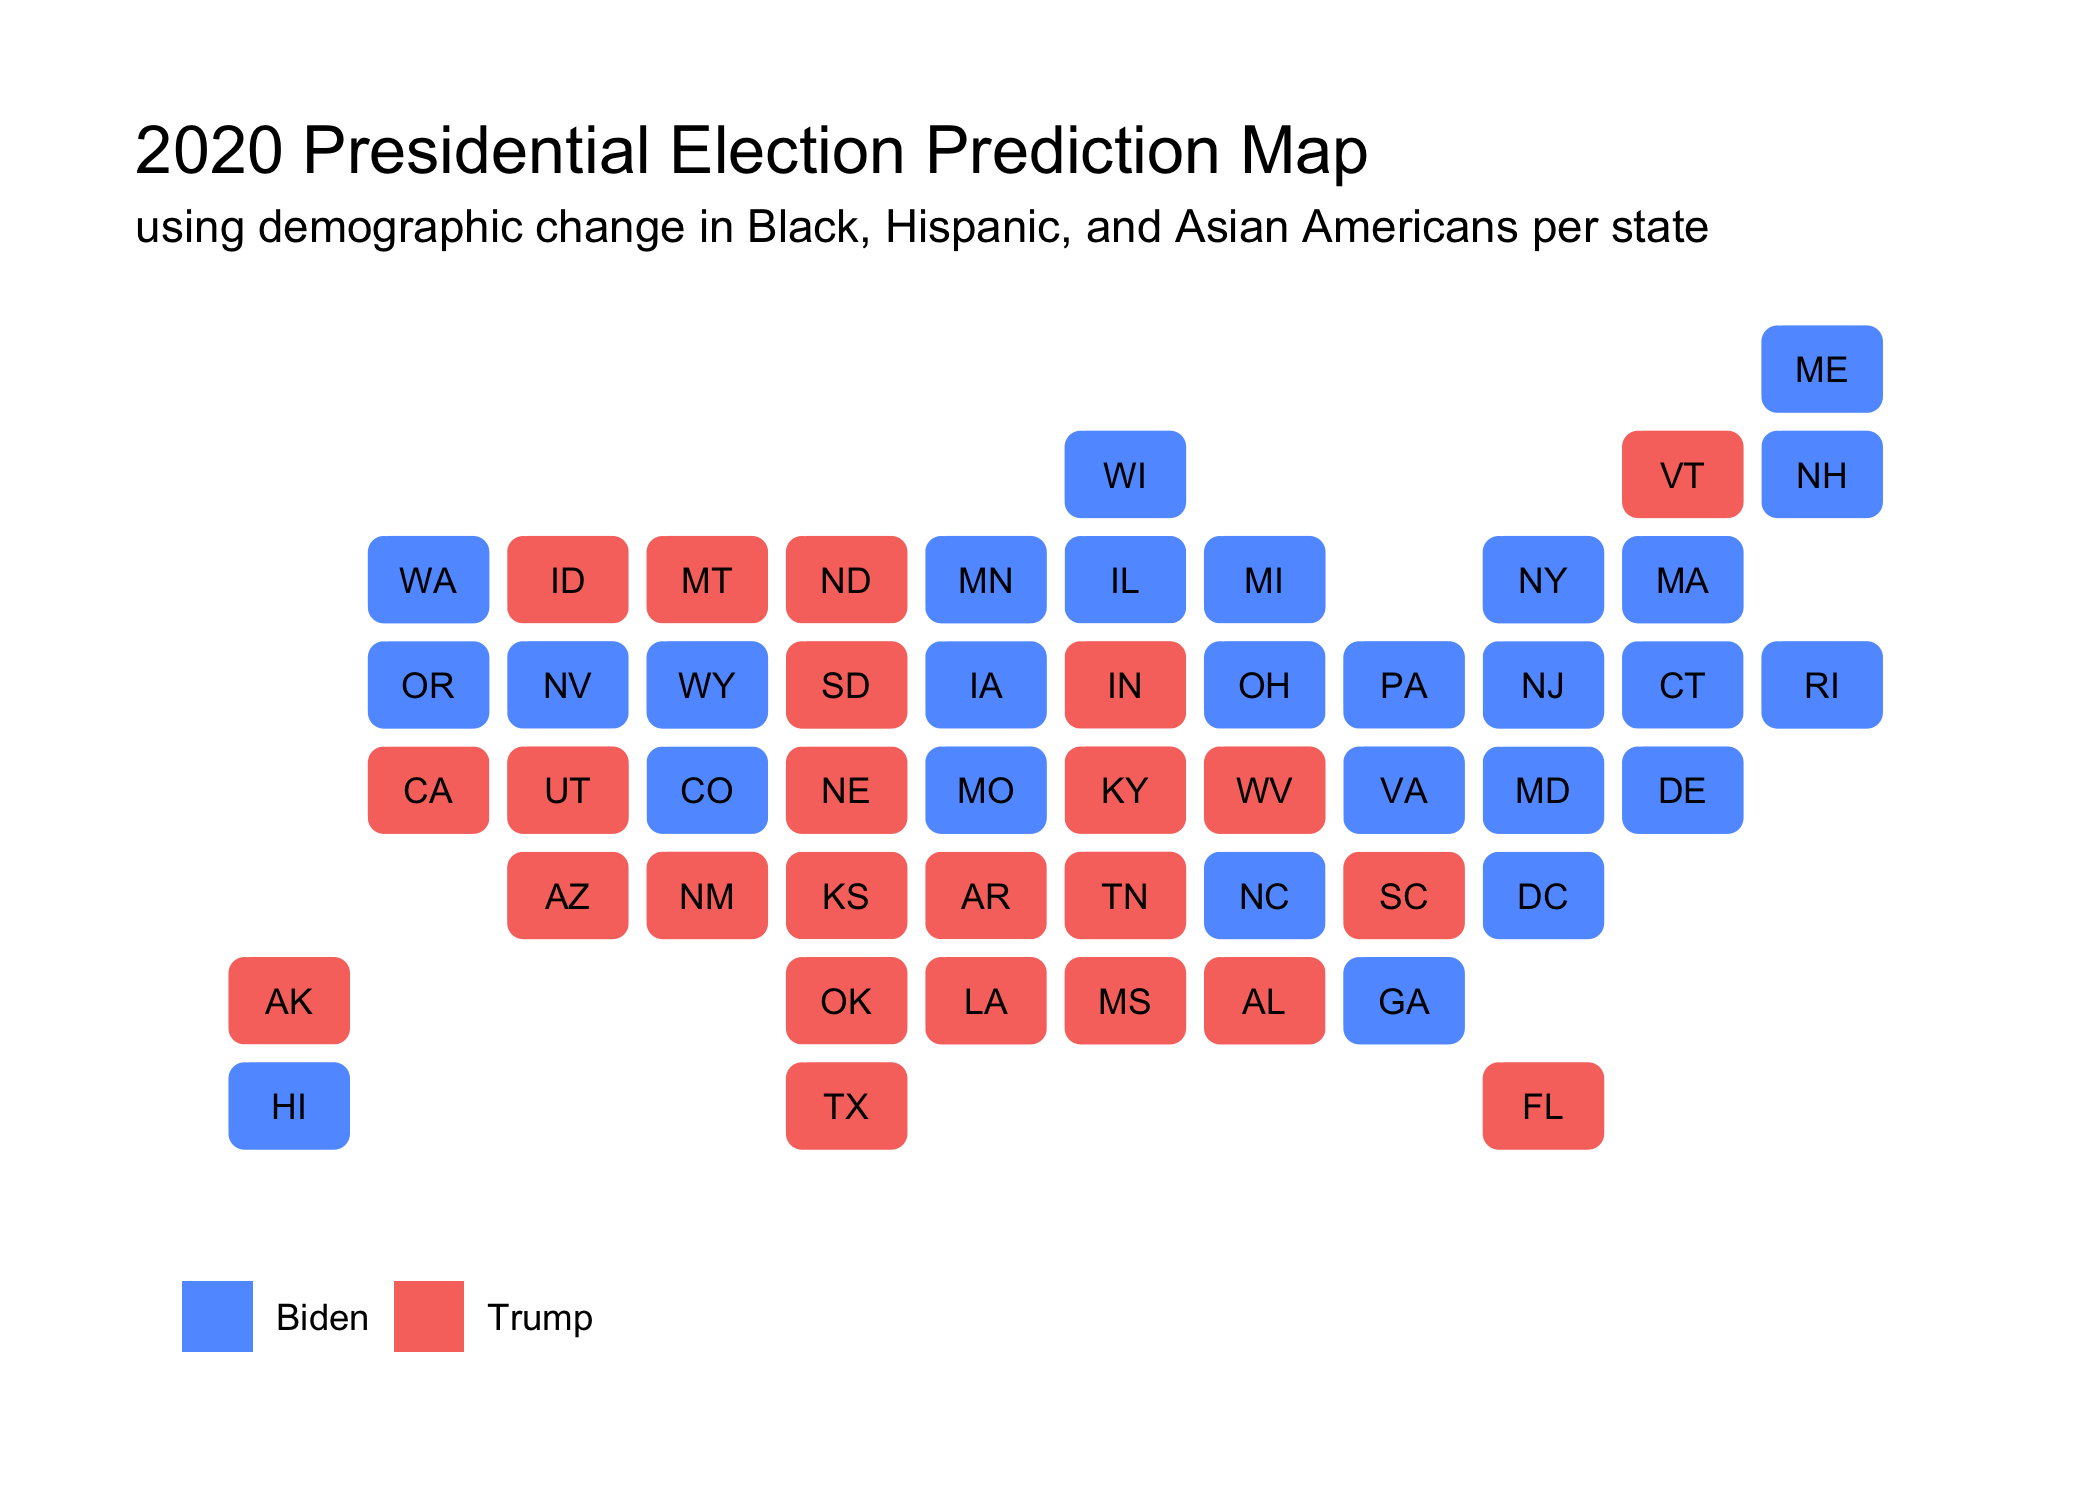

The states that jump out to me on this map are California, Vermont, North Carolina, and Georgia. California and Vermont have consistently voted blue for the past few decades and I don’t see any immediate reasons why they would flip red. North Carolina and Georgia, however, are more interesting. North Carolina has seen a consistent decrease in the proportion of White Americans that make up its demographic. Since 1992, it has decreased by about 10% from 76% to 67%. Georgia shares a similar trend, with the proportion of White Americans dropping from 71% to only 56% since 1992. Given these trends and the demographic voting trends noted earlier, these two states could see a shift to blue in the next few decades. Fun fact: In 2008, Obama won North Carolina by only 14,000 votes!
Takeaways
While demographics alone are not fantastic at predicting this election, I did not expect them to be. Instead, they can provide valuable insights into how some states might shift from red to blue in future elections. There also needs to be concern about using polls and the result of non-response bias that comes from polls if not weighted or adjusted correctly.