
This blog is part of a series related to Gov 1372: Political Psychology, a course at Harvard University taught by Professor Ryan D. Enos.
Using data from Reny and Newman’s (2021), I explore opinions towards the police and about the level of discrimination faced by Black Americans during the protests in the wake of the killing of George Floyd. The topic of exploration this week is symbolic politics and the question we are trying to answer is: Are attitudes towards the police symbolic? Finally I will explore several models evaluating the effects of party and the protests on police favorability.
Background
Reny and Newman’s (2021) find that “Floyd protests swiftly decreased favorability toward the police and increased perceived anti-Black discrimination among low-prejudice and politically liberal Americans”. They base their findings on responses from the Nationscape survey (NS) conducted by the Democracy Fund and UCLA during the time leading up to and after the George Floyd protests in America. In this blog, we’ll be focusing on the favorability toward the police half of the data and looking to see if attitudes towards the police are symbolic. I define symbolic attitudes as attitudes which are stable, constrained, and having power or influence.
The Data
As mentioned above, the the Nationscape survey (NS) is conducted by the Democracy Fund and UCLA. Political scientists Lynn Vavreck and Chris Tausanovitch from UCLA are both invovled and the goal of the project is to “understand voter choices, inform political discourse, and improve political representation across the country”.
The variables in the dataset that we will be evaluating today are group_favorability_the_police, pid7, and before. group_favorability_the_police measures favorability towards the police (1-Very favorable, 2-Somewhat favorable, 3-Somewhat unfavorable, 4-Very unfavorable). pid7 measures a respondents’ party identification on a seven point scale with strong, weak, lean (1-Strong Democrat to 7-Strong Republican with 4-Independent). before is a variable which I encoded from the day_running variable (day relative to onset of George Floyd protests). before is encoded as a 1 if the response came before the George Floyd protests and a 0 if the response came after.
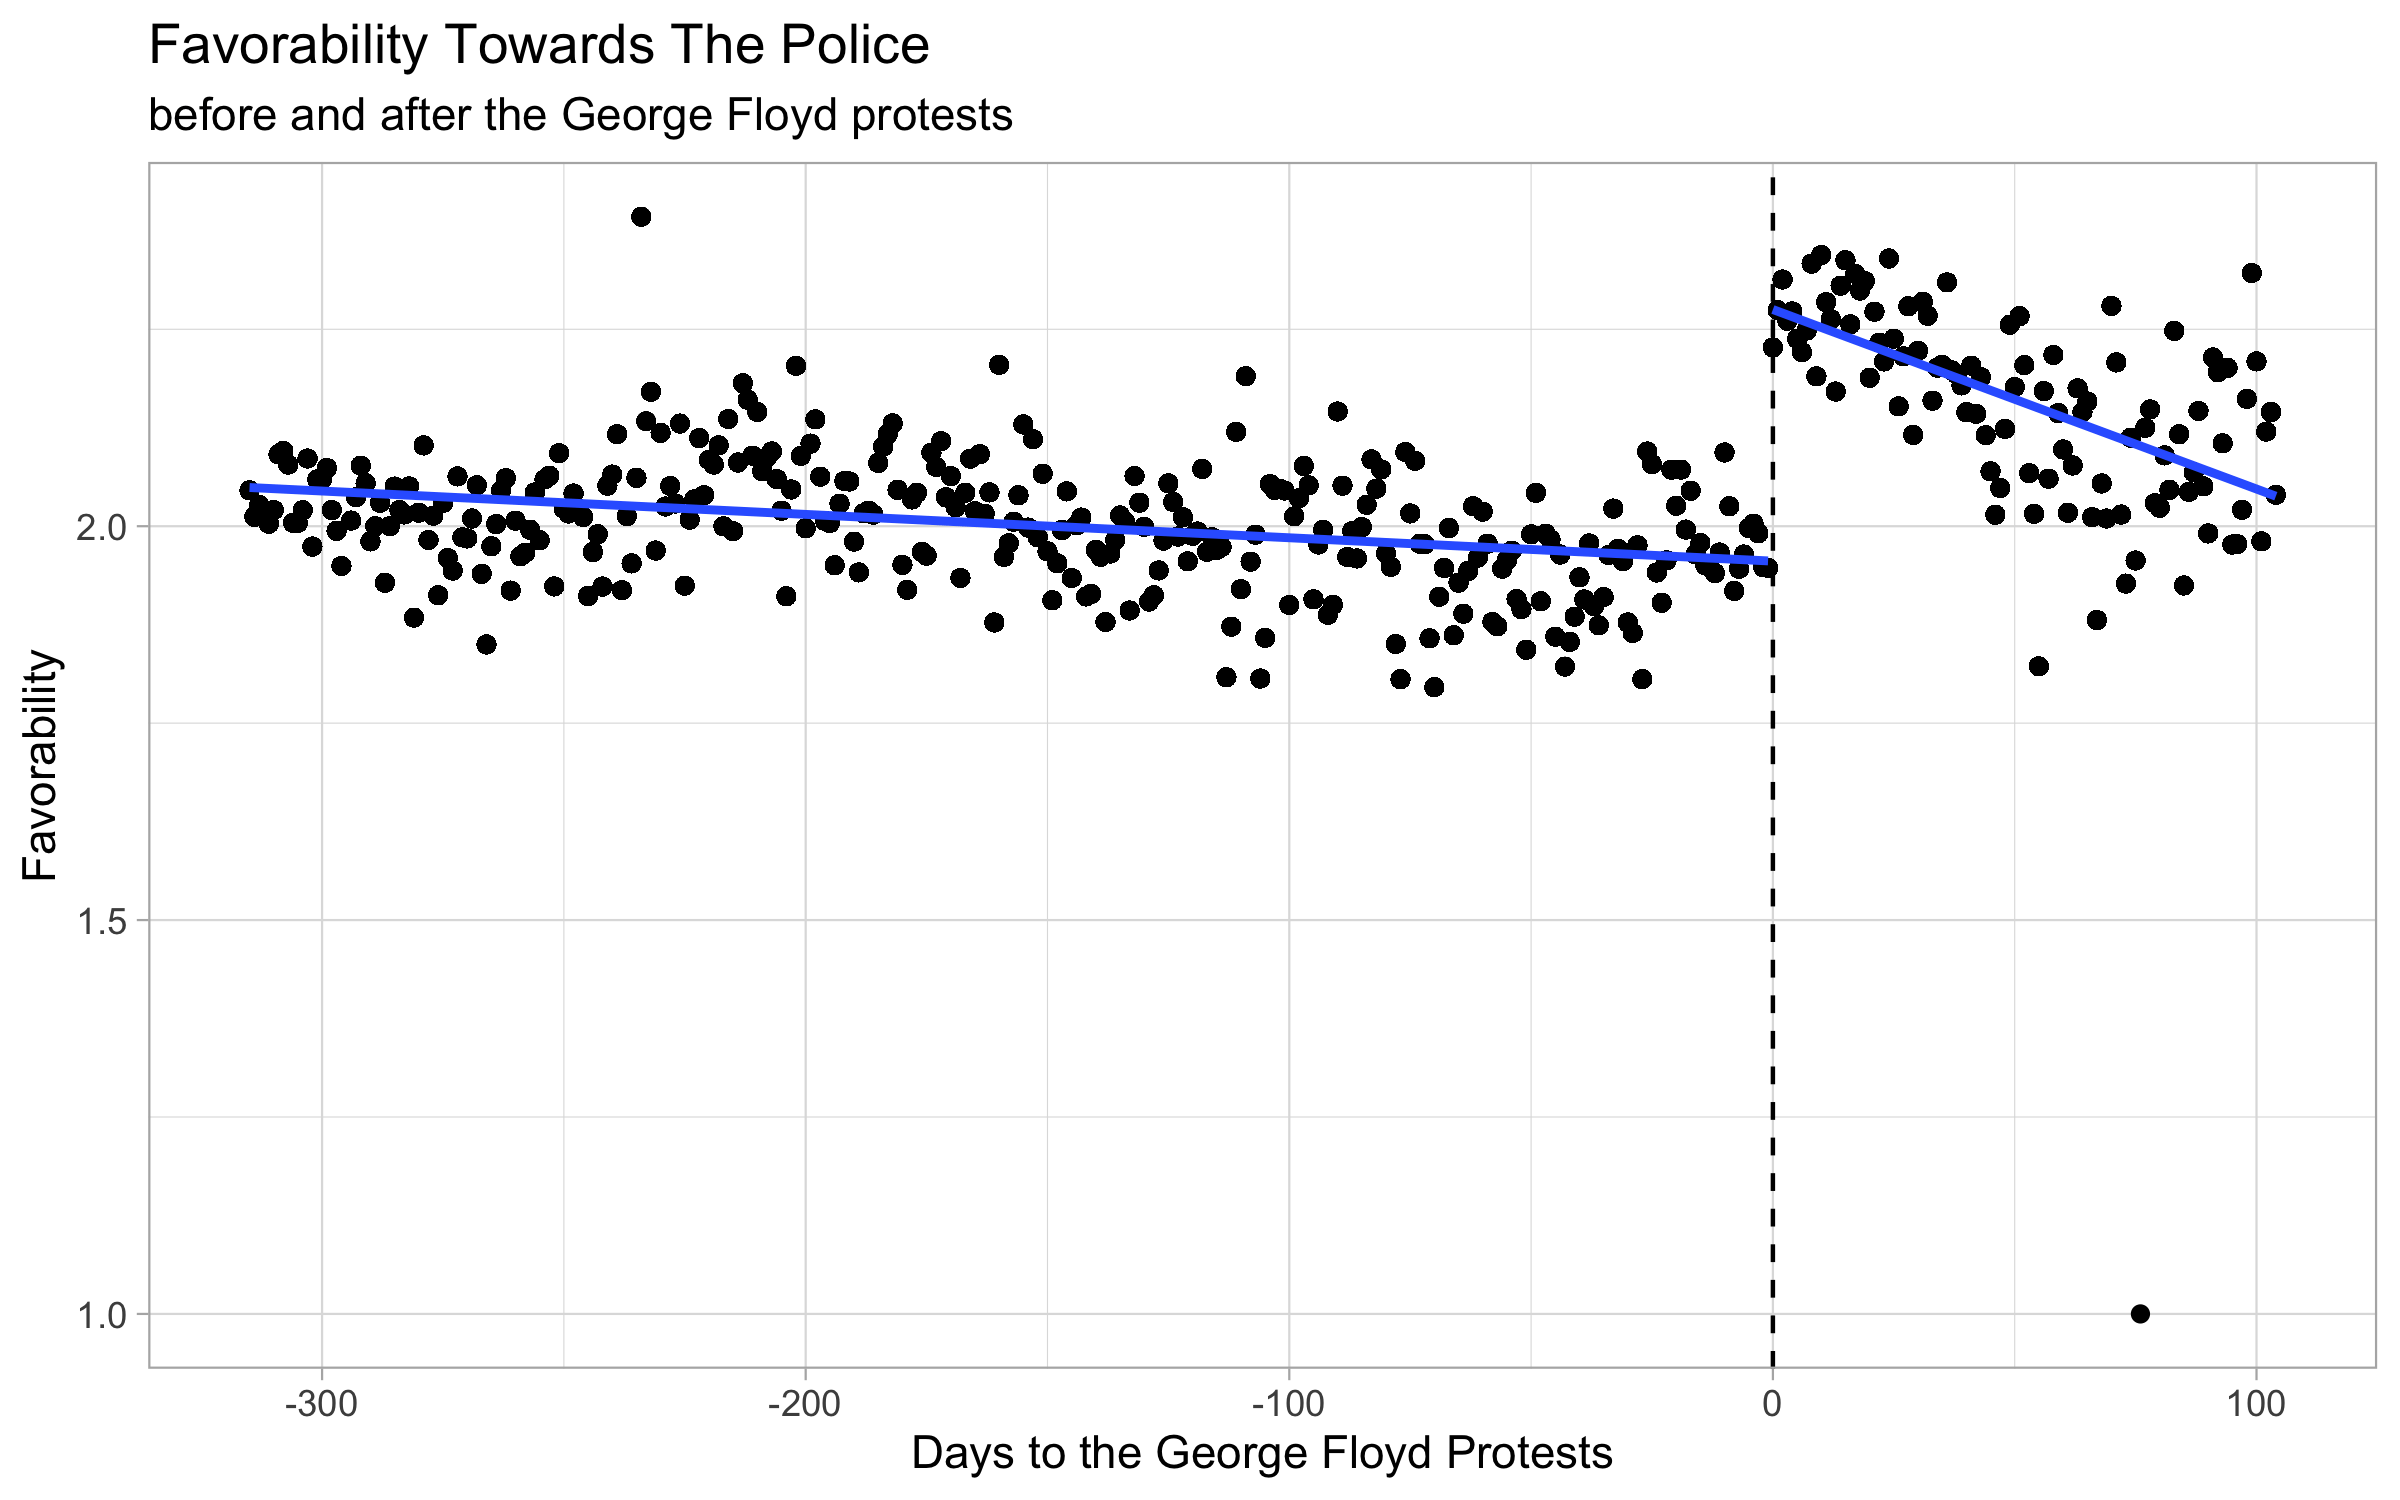
First, I plot the data and general trend of average police favorability relative to the number of days before and after the George Floyd protests. From the plot, we can see that favorability scores stayed around 2 leading up to the protests, then jumped to 2.25 immediately after the onset of protests (higher favorability score means more unfavorable). These attitudes then gradually returned to normal in about the next 100 days of the protests. So, in general, we see an overall average negative attitude shift after the onset of the George Floyd protests across all respondents. However, what would these trends look like if we subsetted the data by party?
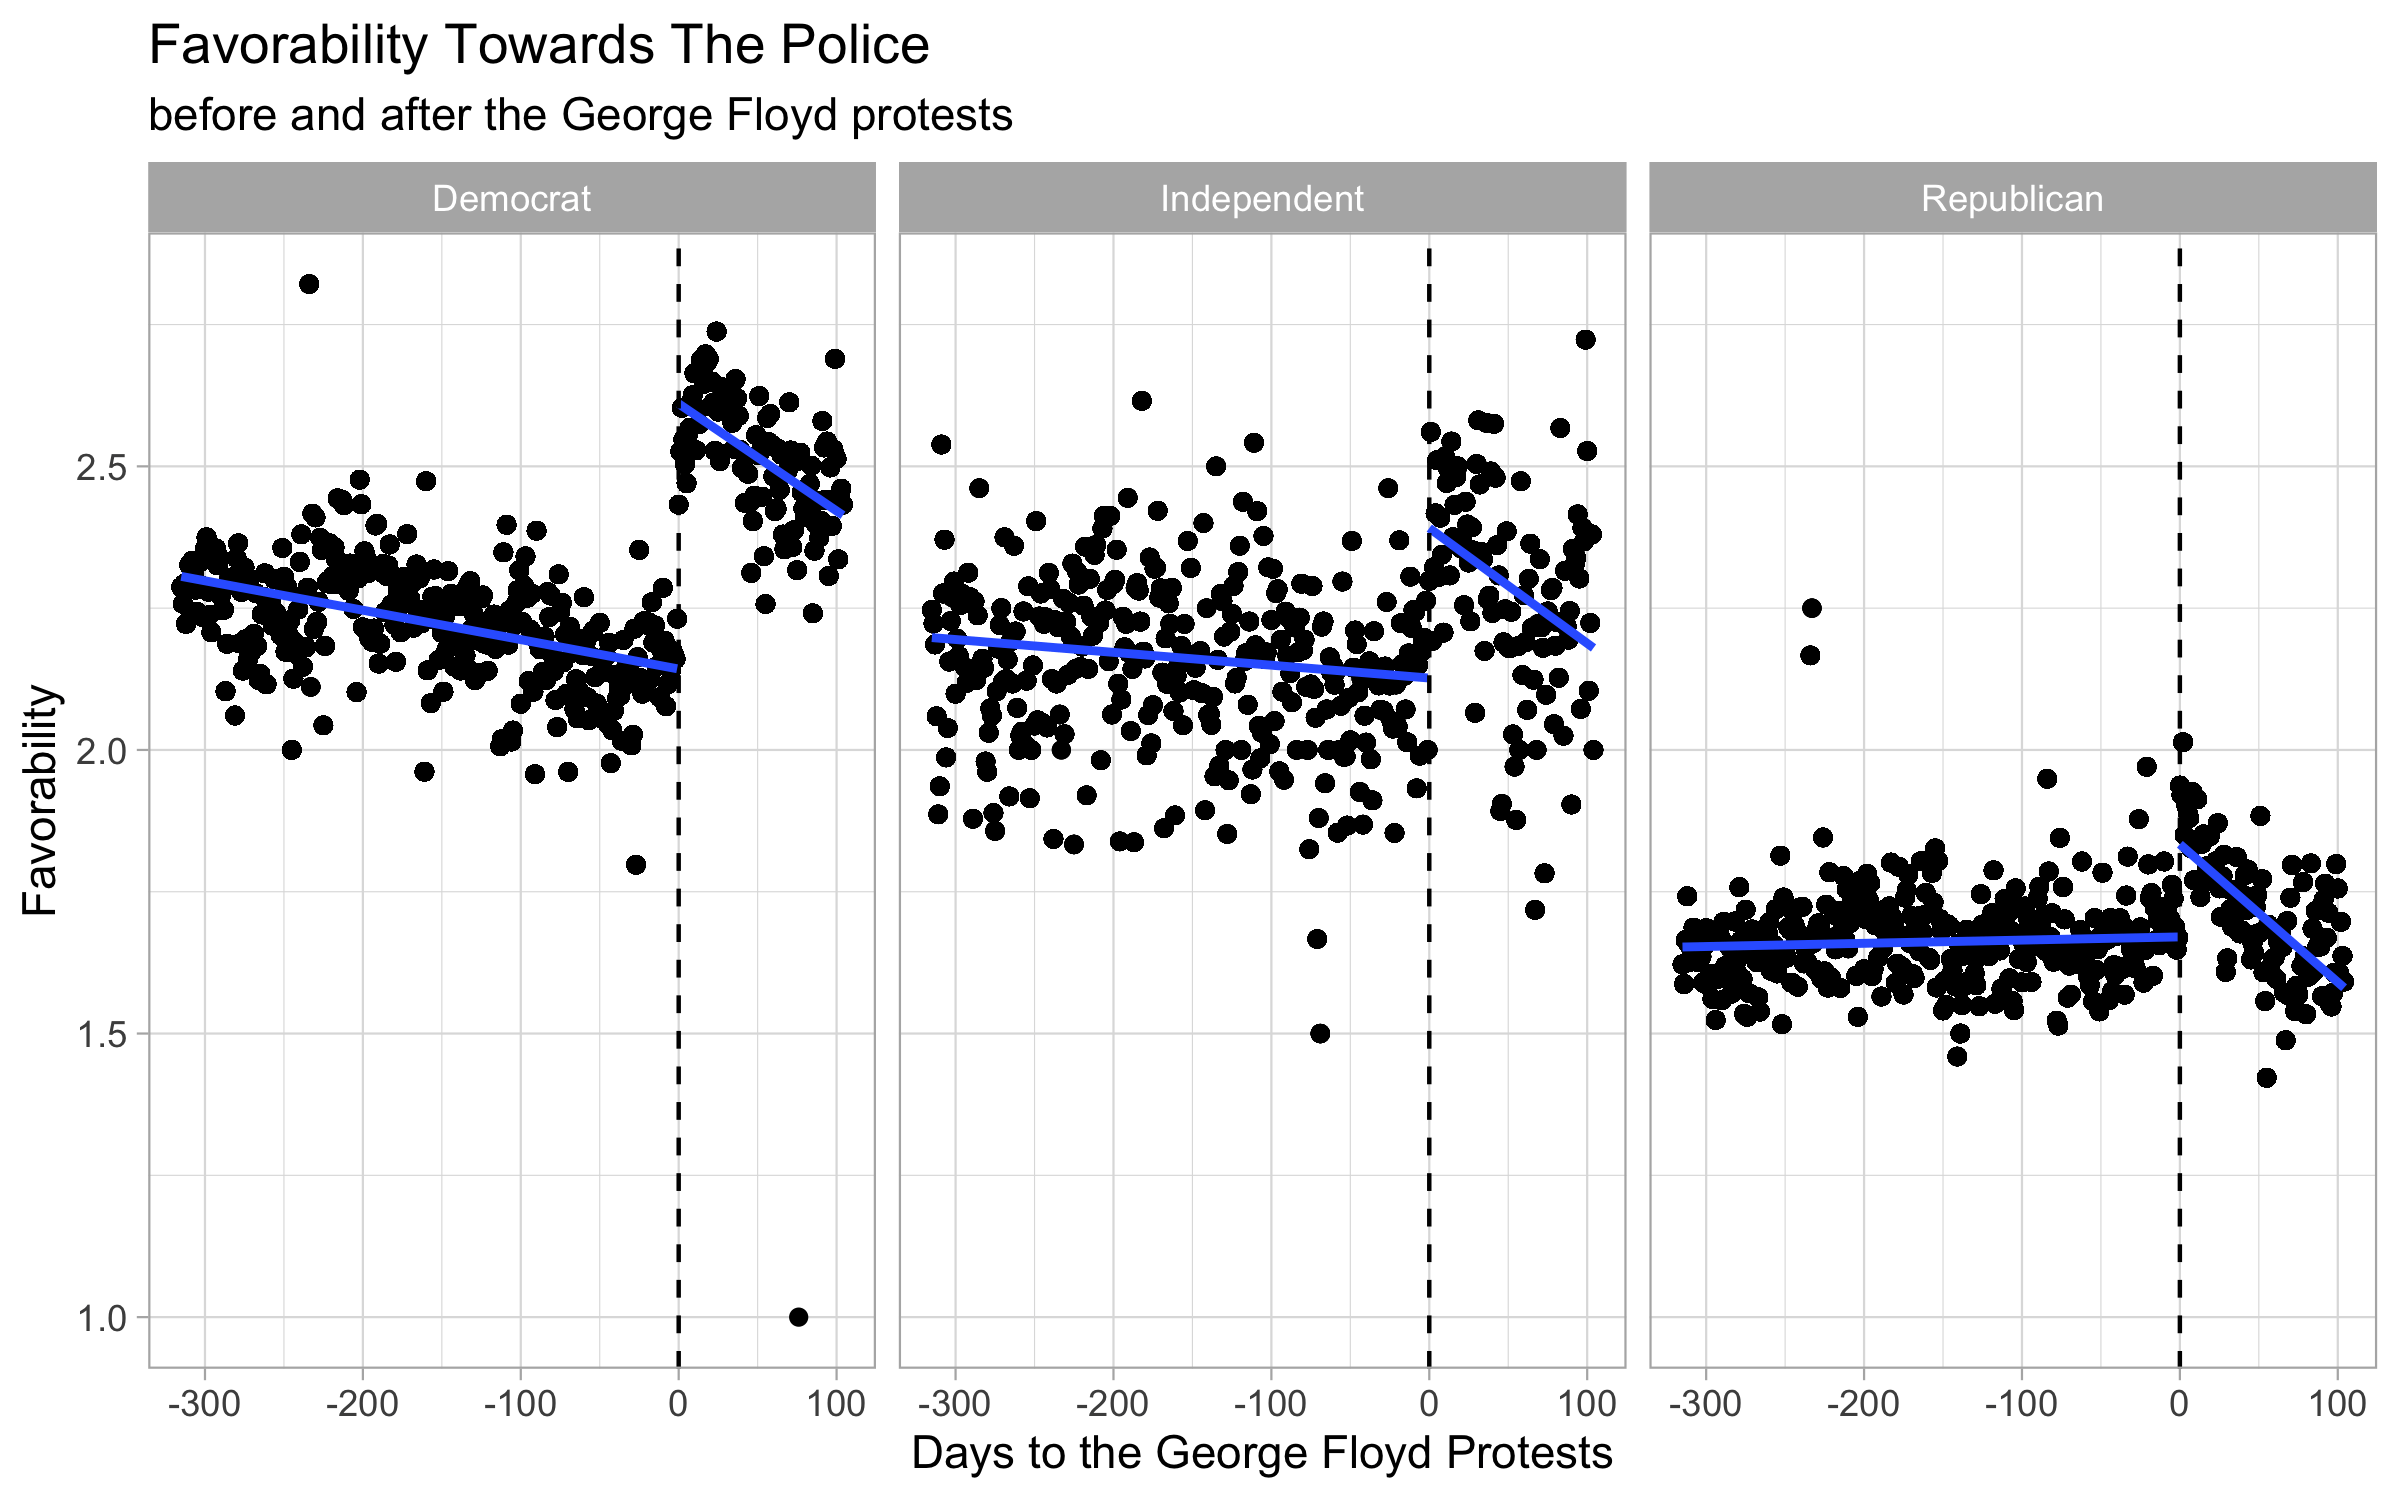
In the next plot, I evaluate the same average trends but subset by party. In this case, I encoded all Democrats and Republicans together instead of separating with strong, weak, lean. We can see trends that we might expect: Democrats have more unfavorable views on police in general compared to Republicans and Independents are somewhere in between. However, we also see that favorability towards the police across all three groups increased towards less favorable right after the George Floyd protests. However, the favorability among Republicans quickly returned to pre-protest levels while the favorability among Democrats are still much higher even 100 days after the onset of protests. For Independents, we see much more variability among the data. However, favorability do seem to have shifted back to pre-protest levels as well after 100 days.
From these two plots, my initial reaction is that attitudes towards the police are not symbolic as they shifted after the onset of the George Floyd protests. While favorability among Republicans quickly returned to pre-protest levels, they did not for Democrats. This violates the stability rule for symbolic attitudes.
Models
In the next part, I create three models (OLS, Logit, and Probit) to evaluate the effect of pid7 and before on group_favorability_the_police. I chose to compare the results of these three models mainly to show the importance of choosing the right model and why OLS is not ideal for ordinal data.
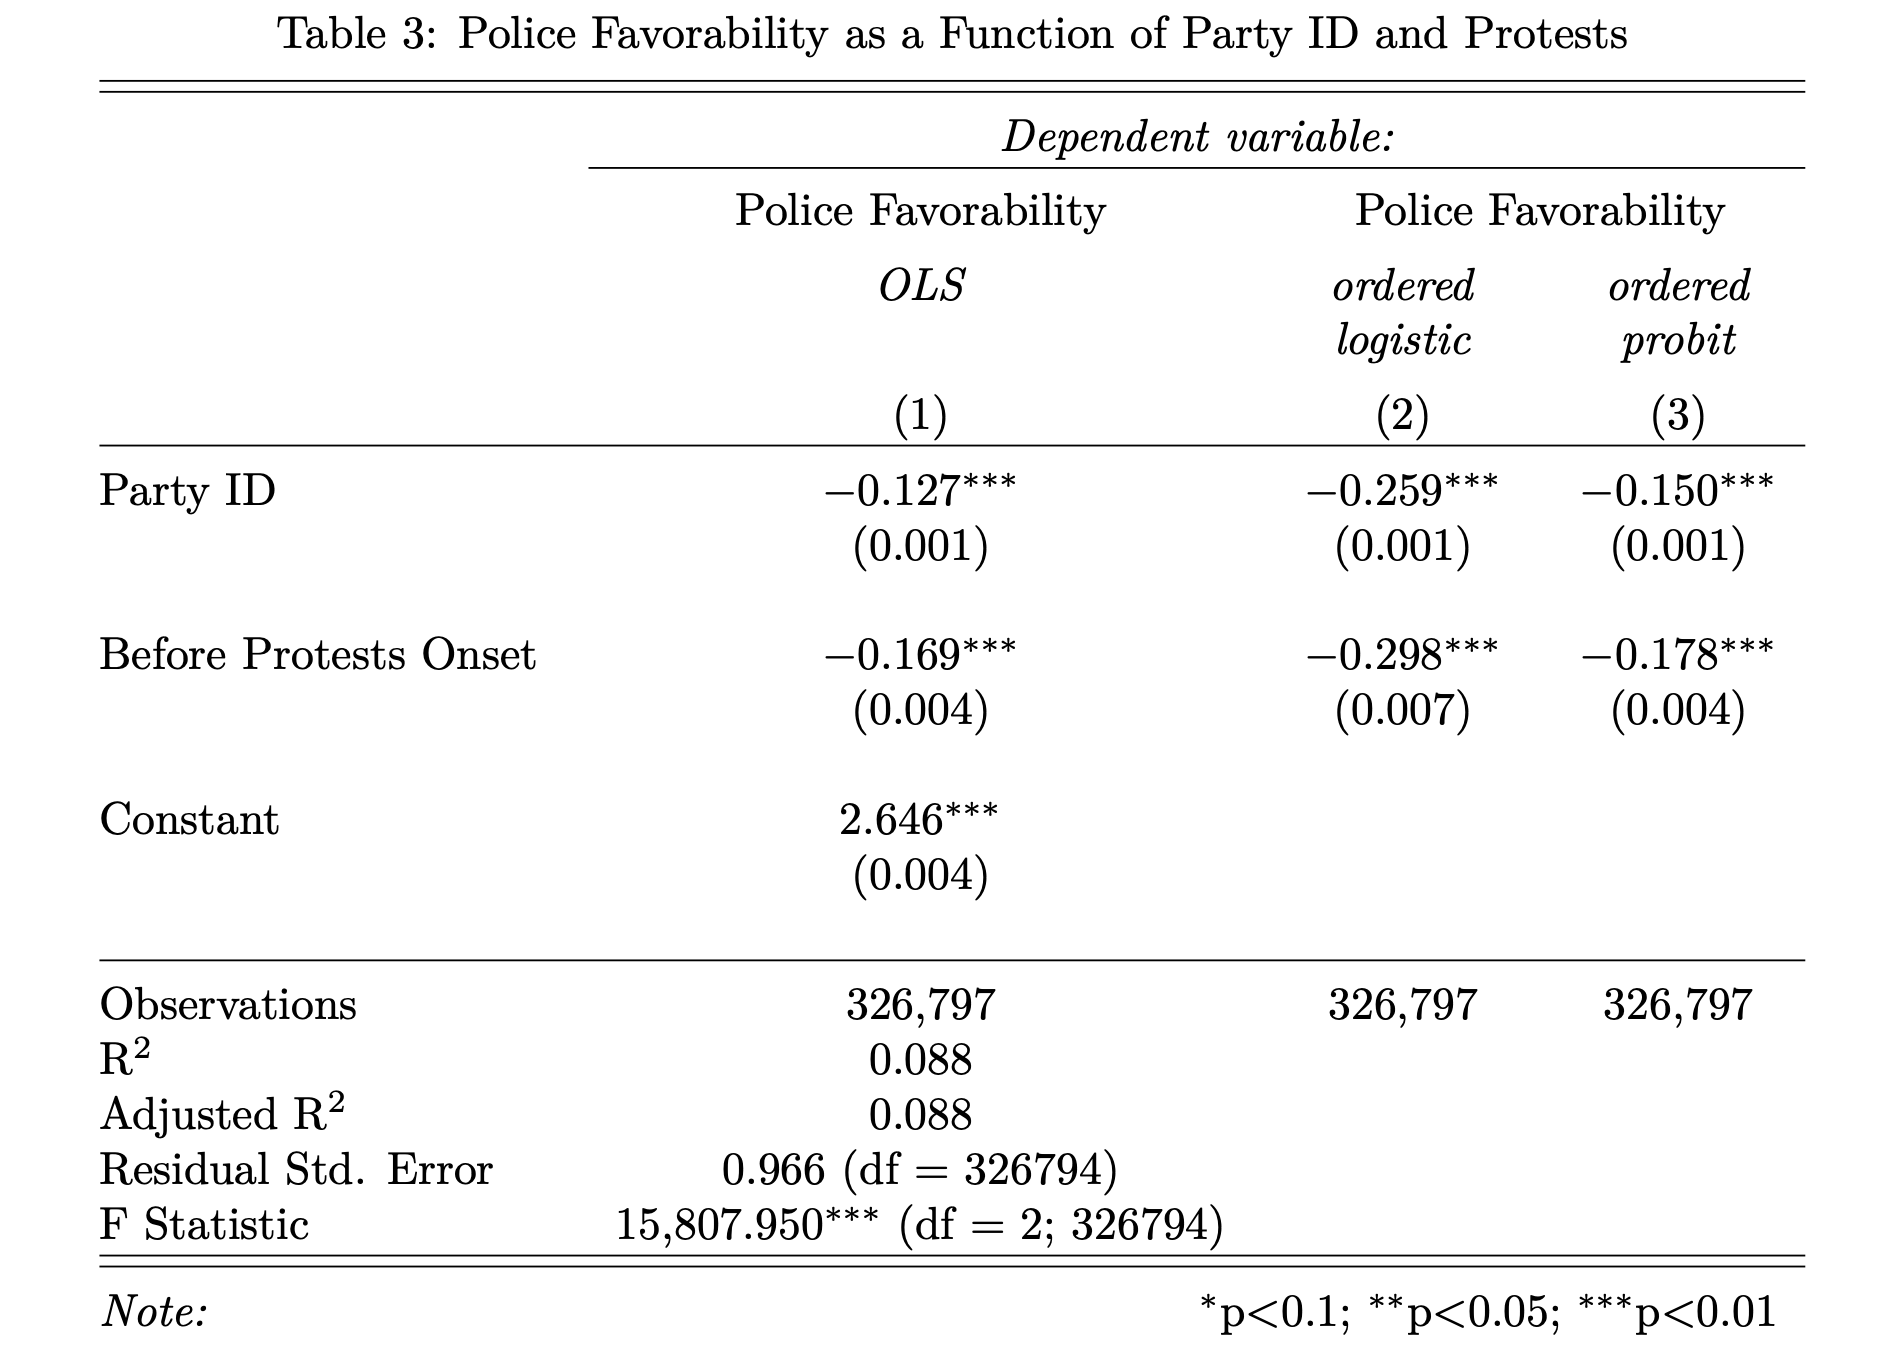
From the three models, we can see generally that they have the same trend. Taking the OLS results as an example, we can see that a one point increase in party ID (towards Republican) is associated with a decrease on average of 0.127 on the police favorability scale (lower is more favorable). Attitudes, on average, across all respondents were 0.169 more favorable towards the police before the onset of the protests. Both of these results are statistically significant at the 95% level with p-values below 0.01.
While the three models all show the same trend, the coefficient effects for the logit model are about twice as large as the OLS model and the effects for the probit model are just slightly larger. This difference is due to the logit model using a cumulative standard logistic distribution and the probit model using a cumulative standard normal distribution. If I were to expand upon these model, I might perhaps look at implementing a heteroskedastic probit model to account for non-constant error variances (the increase in variability of responses) that might alter the magnitude of effects.
Conclusion
From the data, I find that attitudes towards the police are not symbolic attitudes due to their variability in nature after the onset of the George Floyd Protests. That being said, I would still like to analyze other variables relating to attitudes towards the police such as attitudes to certain laws, crimes, or policing approaches. My full analysis on GitHub includes analysis of other variables in the dataset such as racial resentment and anti-Black discrimination. As mentioned in the final paragraph regarding the models, I would be interested to see if a heteroskedastic probit model might have different results when accounting for non-constant error variances for responses from groups such as Independents who we saw had much more variability in their responses.