
This blog is part of a series related to Gov 1372: Political Psychology, a course at Harvard University taught by Professor Ryan D. Enos.
This week I’ll be exploring how personality affects political ideology based off the research of Carney et al. (2009). Using methods from Rammstedt and John (2007) and Gosling et al. (2003), we surveyed students’ personalities in our class using BFI-10, a short version of the Big Five Inventory, and TIPI, the Ten-Item Personality Inventory. Using these measures of personality that focus on the big five traits: extraversion, agreeableness, conscientiousness, emotional stability, and openness, I connect them to the findings in Carney et al. (2009) to explore the survey methods tying personalities to political ideology.
Background
Carney et al. (2009) found that “liberals are more open-minded, creative, curious, and novelty seeking, whereas conservatives are more orderly, conventional, and better organized.” from conducting several samples of Americans using several measures of the big five personality traits, including BFI and TIPI. Using specifically the big traits, they found that openness was most positively associated with liberalism and conscientiousness was most positively associated with conservatism. Professor Enos surveyed students in our political psychology class using BFI-10 and TIPI to test if the findings from Carney et al. (2009) stayed true in our Harvard class. This will be the dataset that I explore throughout the rest of this blog.
The Data
The survey data of my class included self-reported overall, social, and economic ideologies on a 1-5 scale with 1 being extremely liberal and 5 being extremely conservative. I will only be focusing on the overall ideology in this blog. The survey also asked 10 questions (2 for each big five personality) from each of the two tests, BFI-10 and TIPI. The average of each of the 2 big five personality for each test was then saved to a new variable such as BFI_extraversion, TIPI_extraversion, BFI_agreeableness, TIPI_agreeableness, etc. BFI-10 uses a 1-5 scale and TIPI uses a 1-7 scale. We’ll compare how these two differ in the next section. But first, I’ll start by comparing the average results from our TIPI results to the ones in Gosling et al. (2003) to ensure that our measurements align somewhat with the published results.
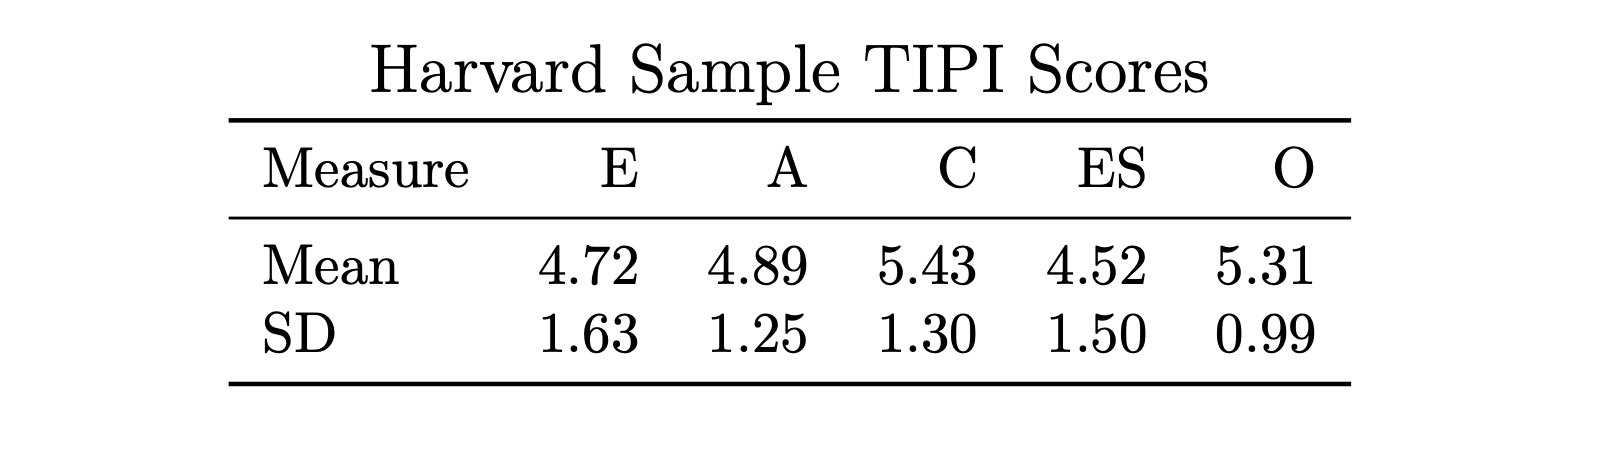
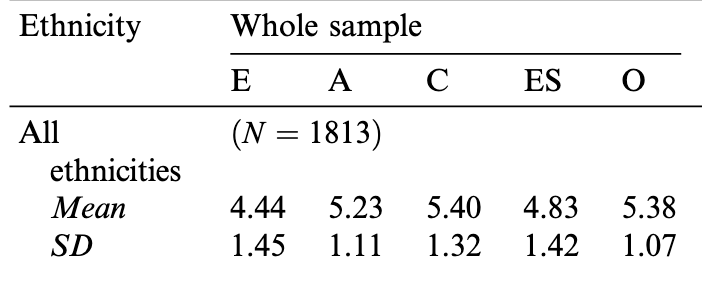
Comparing the averages from our Harvard sample with the published results in Gosling et al. (2003), we can see that the TIPI scores are very similar across the board. Our sample had almost identical results in terms of conscientiousness and openness and a slightly higher score for extraversion, agreeableness, and emotional stability. However, the differences were all well below one standard deviation, so they could just be within the margin of error. This helps us validate that the survey was run correctly and that no errors were likely made in the cleaning of the data. Now, I can move on to analyze the distribution of the responses for each trait. For fun, I also highlight my responses within the sample.
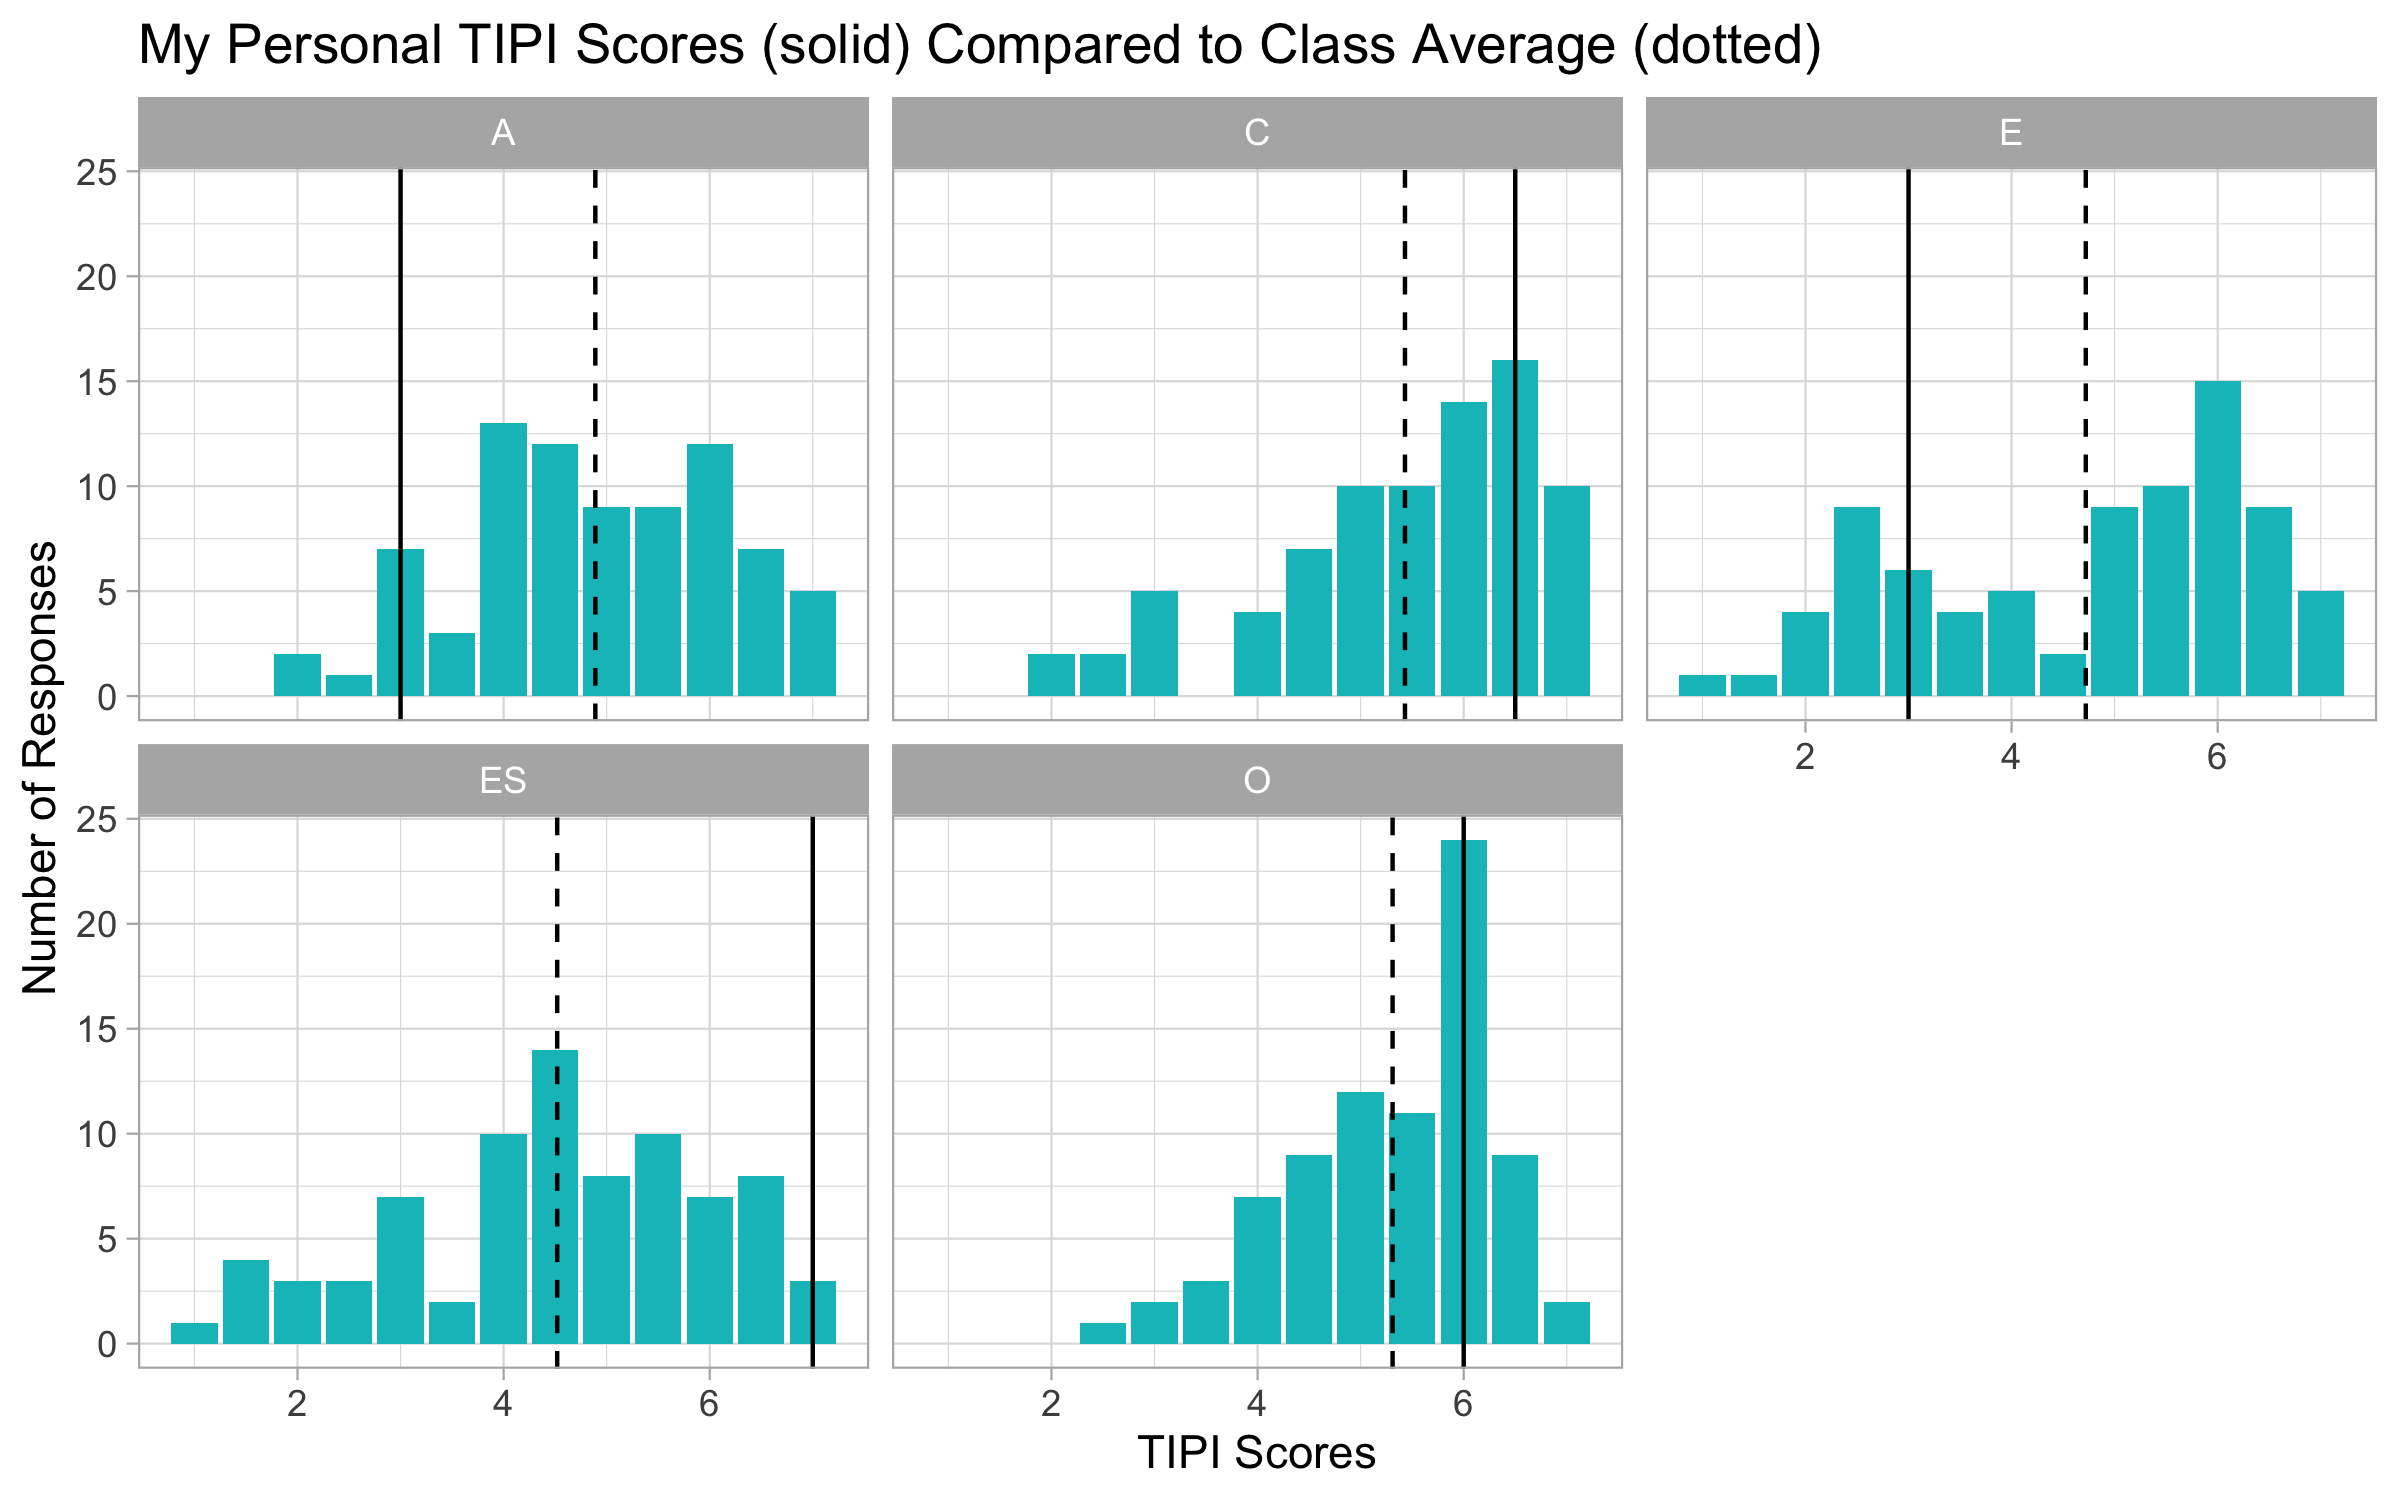
Starting with the distribution of the scores, we can see that most students scored higher on the TIPI scale for each of the five traits, with all of the average scores being higher than 4 on the 1-7 point scale. For each of the traits, the average score is between 4.5 and 5.5. Comparing my TIPI scores (solid line) with the class average and distribution, I find that I had the most common scores on conscientiousness and openness, slightly lower scores for agreeableness and extraversion, and a higher score for emotional stability.
So, we know that the scores from the survey makes sense. However, one cause for concern might be how the two methods compare with one another. In the next section, I plot students’ score for each trait based on question from both methods.
TIPI vs BFI
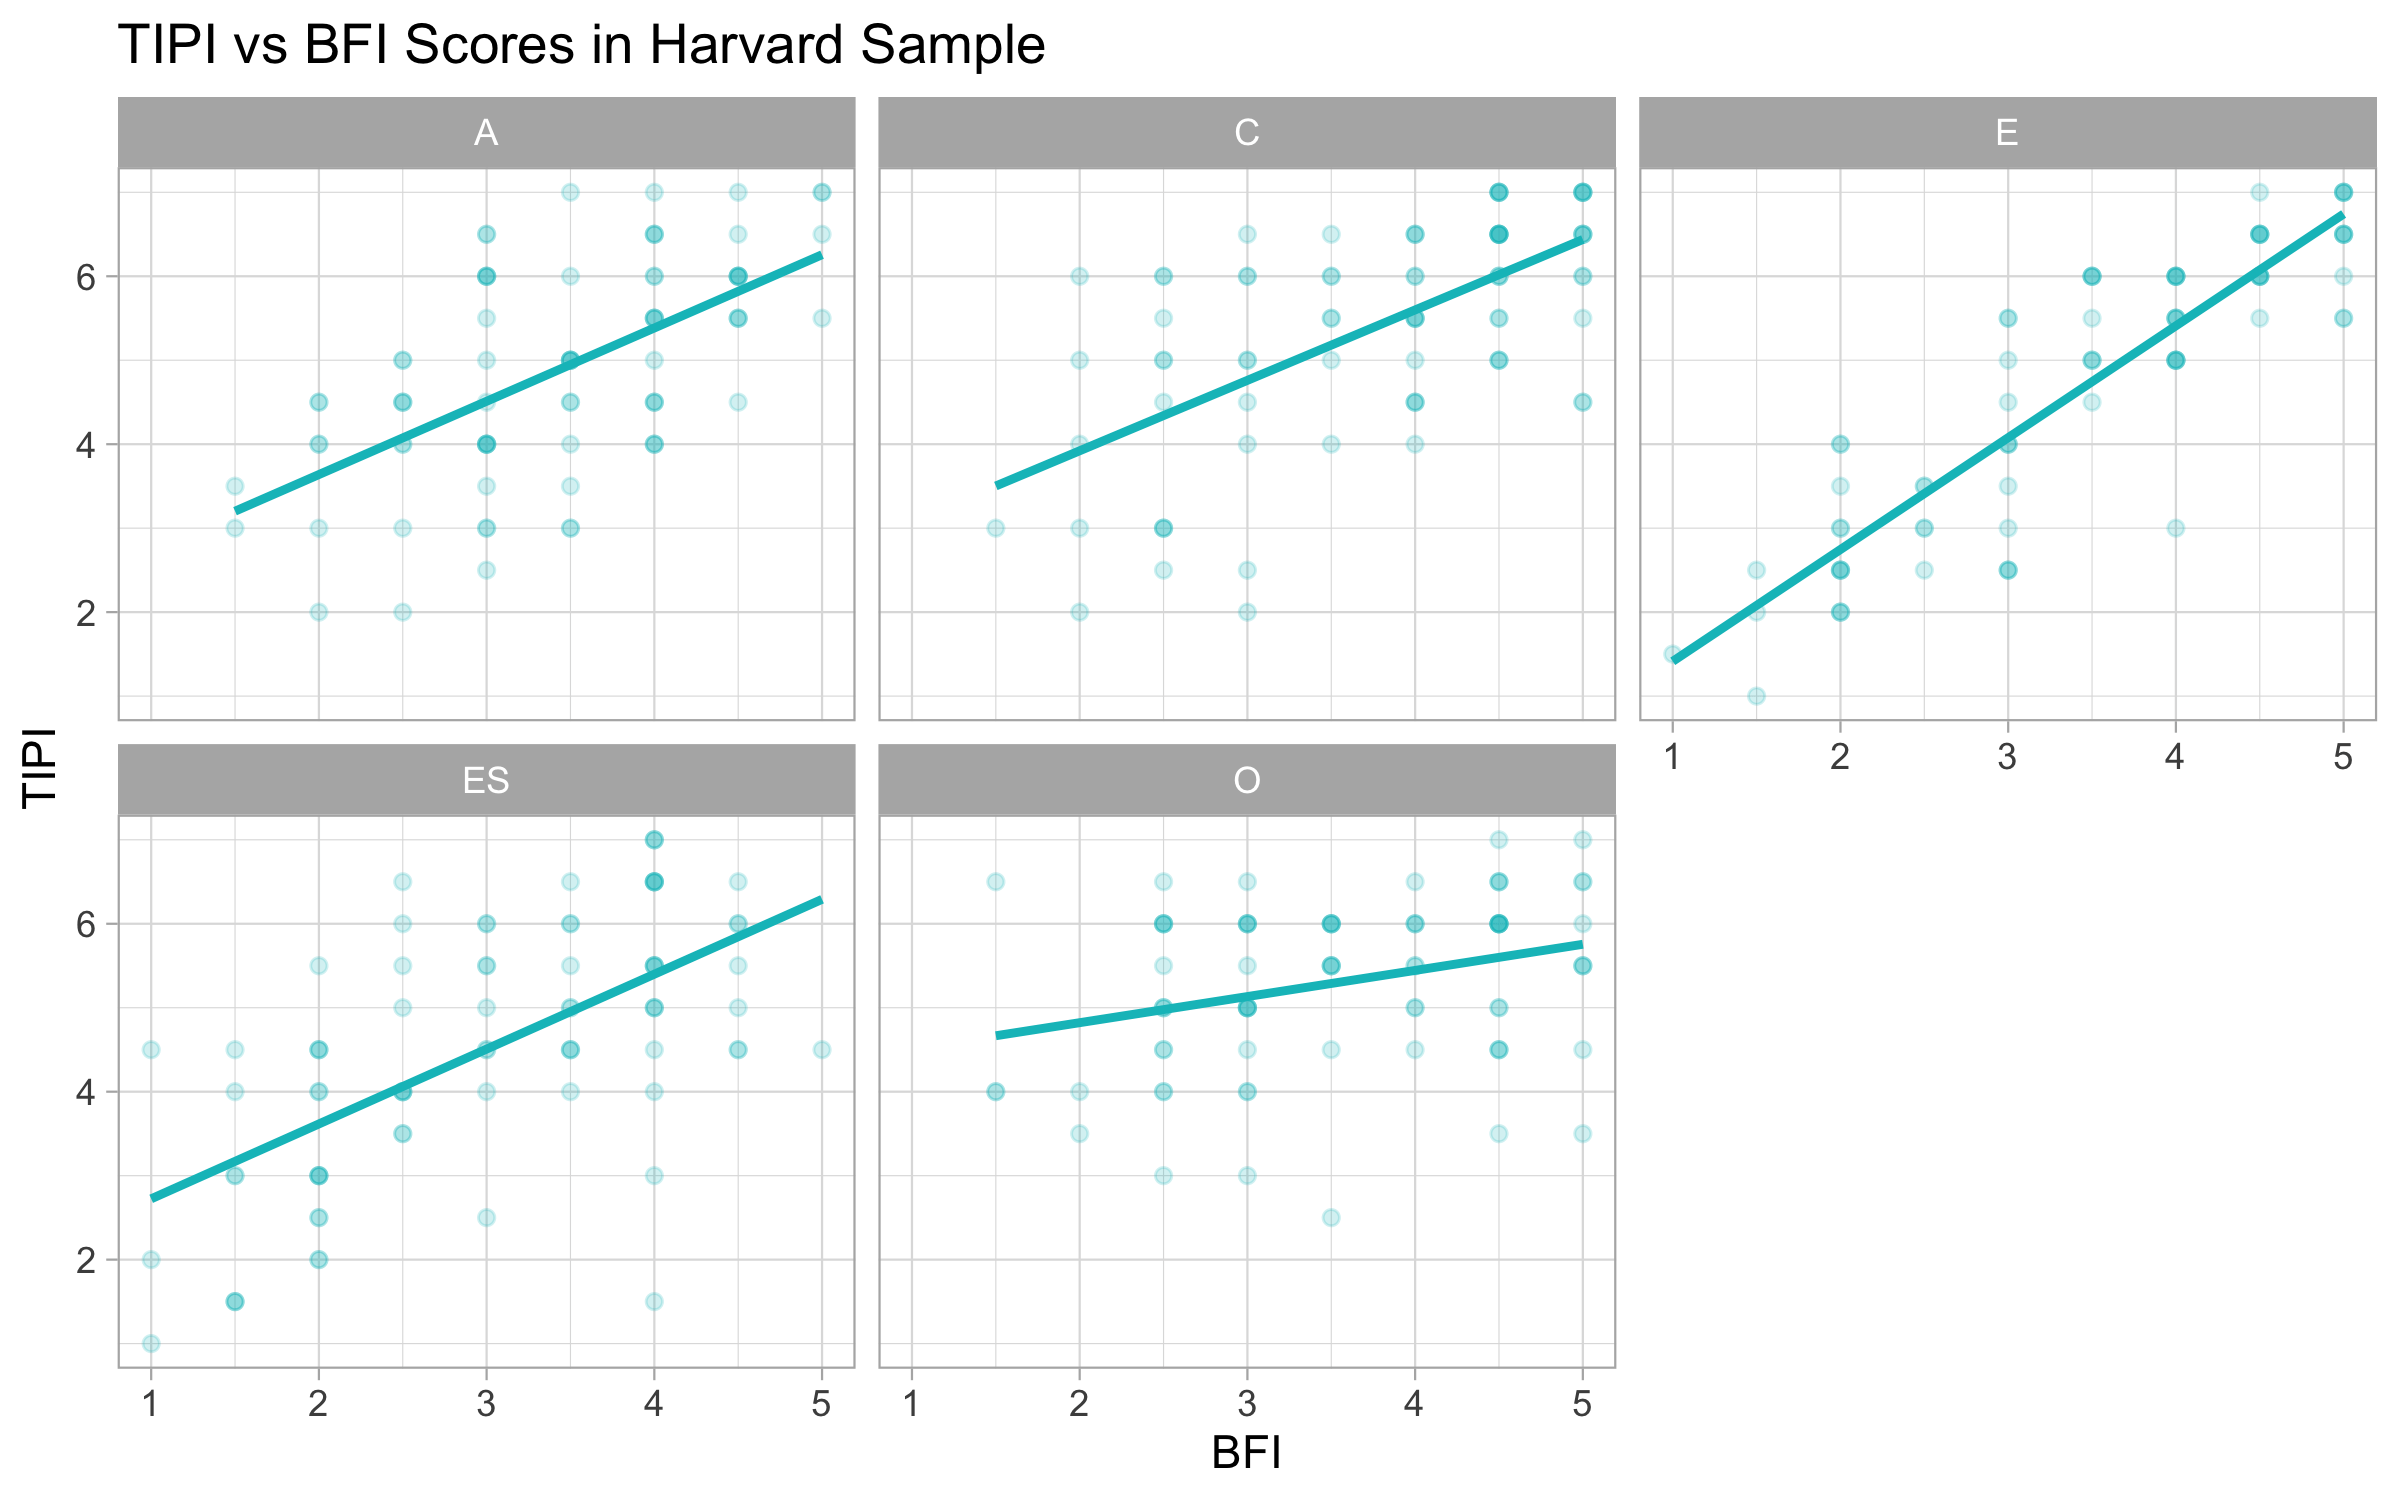
Comparing the two different methods used to measure personality in our class survey, we can see that TIPI and BFI both have a positive correlation for each of the five personality traits. However, the two methods do not measure each trait in the same way. For example, we can see that for extraversion (E), the correlation between the two is extremely strong. However, the correlation between the two for Openness (O) is much weaker. This tells us that generally the two methods are both measuring the same constructs in our class sample, however the magnitude of the effects vary depending on the method used.
At first, this seems alarming since openness was one of the strongest traits linked to political ideology in Carney et al. (2009). However, thinking about our sample frame makes me wonder if the missing conservative respondents in our sample makes the relationship less apparent since most of the respondents are liberals. Perhaps the conservatives have much lower openness scores on both scales and that is just missing from our sample. That being said, this still brings up a concern about Carney et al. (2009) in that different tests might have different interpretations of how to measure each trait.
Conclusion
Using our class sample to evaluate the research methods in Carney et al. (2009), we learn that the type of method used to measure personality might have an effect on how reliable we can use personality to tie to political ideology. In our sample of mostly liberal students at Harvard, we find that TIPI and BFI both generally measure the big five personality traits. However, they produce different magnitudes of each trait for different respondents. Further research into this topic could perhaps use a skills assessment developed with behavioral science to support a test-based method instead of self-reported measurement of personality.