This blog is part of a series related to Gov 1347: Election Analytics, a course at Harvard University taught by Professor Ryan D. Enos.
This week, I am be looking at polls and incorporating them into prediction models alongside a measure of the economy. I’ll begin with comparing the different grades of polls and looking at the polls from 2016 and 2020. Then, I’ll take a dive into state polls and create a model to try and predict the election outcome in Florida for 2020.
Poll Grades
Polls have long been used to gauge how people feel about a certain idea, subject, or in this case the presidential election. If you follow the media coverage leading up to any presidential election in the past, you might recognize some of these polling firms that track the general election: Siena College/New York Times Upshot, YouGov, ABC News/The Washington Post. However, you might not know that not every polling firm is weighted equally in some prediction models that use polls. FiveThirtyEight for example, gives a letter grade to each of the pollsters that they track and add in their predictive models. They explain this grade based on how pollsters have done in the past and specifically by looking at their past margin of errors. As a result, these grades are regularly updated before each election.
But how different really are different grades of polls? Taking a look at the average 2016 polls by grade from June to November compared to the actual popular vote provides some interesting insights:
I chose to filter out polls before June because of evidence that polls get better as time approaches closer to the Election
The first thing to note is that no poll average included in this table was wildly off the mark - eg: The C- grade polls were not so off that it should be deemed irrelevant and useless. The averages for each grade had a prediction between about 40 and 47 for Clinton and between about 35 to 43 for Trump. However, we can see that the standard deviation or margin of prediction for Clinton in 2016 generally increased as the poll grade got worse.
Looking at how accurate the polls were in predicting the popular vote for each candidate, the average of A+ polls just about nailed the popular vote for Clinton. However, most polls were off for Trump - only the C+ poll average was in the ballpark.
2016 and 2020 Polls
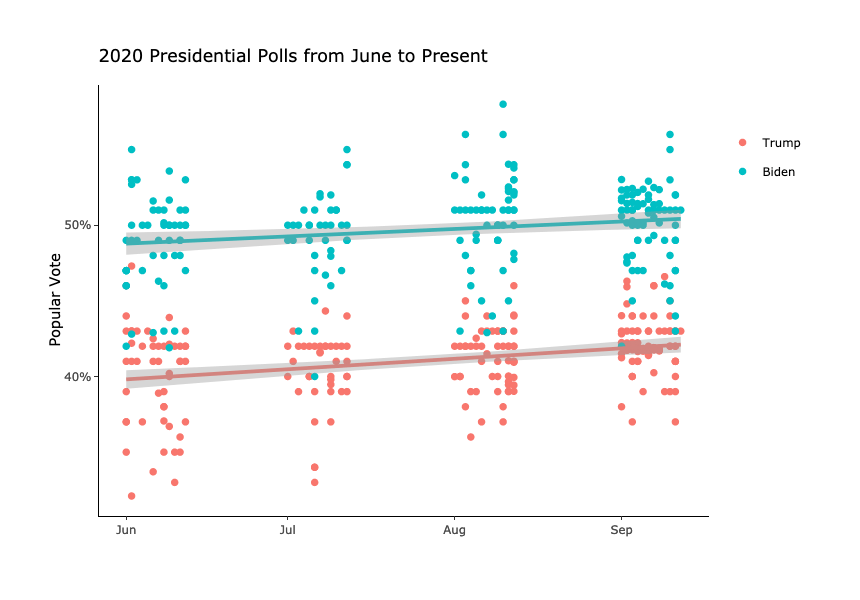
Next, I take a look at the polls for the 2016 and 2020 general elections. On the graph each point is a poll and for each poll I include the grade and popular vote prediction. Once again, I chose to start by looking at polls from June to election day.
The 2016 polls are interesting in that it shows both candidate having an average increase in popularity among people who were polled. However, Trump has a much steeper increase and was polling on average just below 3% of Clinton right before Election Day.
Now taking a look at the 2020 polls, there is a clear average difference of about 8% since June between the support of Biden and Trump. This is a completely different picture than the 2016 graph and just based on polls alone, Biden shows a clear victory in November.
Predicting Florida
In the last part of this post, I will be looking at state polling instead of national polling and trying to use past Florida polls to predict who will win in Florida for the 2020 election.
I start off by taking Florida polls from 1980 to 2016 and looking at polls specifically 20 weeks before Election Day. Then, I created a model using average poll numbers and GDP growth in Q2 of election year to try and predict popular vote. I chose to look at polls 20 weeks before Election Day to keep it consistent throughout this blog and Q2 GDP growth because Q2 GDP growth data is the most recent data available for 2020.
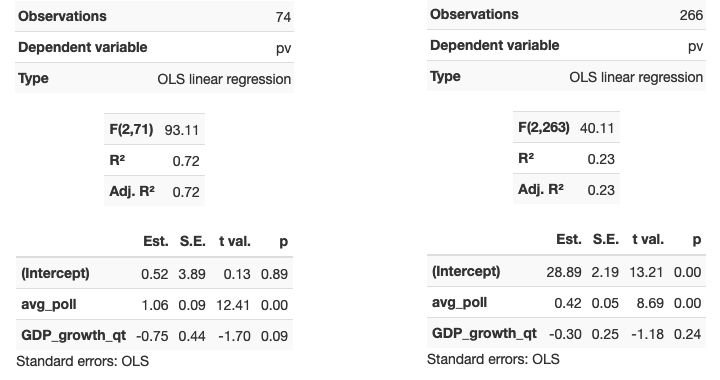
I then created two models, incumbents (left) and challengers (right), and split the data randomly into a 75% training set and a 25% test set. The models created from the training set are shown above. Surprisingly, Q2 GDP growth seemed to negatively impact the incumbent candidate (-0.75) more than the challenger (-0.30). However, the average polling numbers benefit the incumbent by almost double (1.06) than the challenger (0.42).
Using these models to predict the training set data, they correctly predicted the winning candidate 65.8% of the time and were incorrect 34.2% of the time. Predicting the whole dataset gave similar results: 65% and 35%. So, these models are not great, but they are slightly better than a 50/50 coin toss.
Using these models to predict Trump and Biden in 2020, they give Trump a 54.5% prediction of the popular vote and Biden a 52% prediction. To note: these numbers were predicted separately so that’s why they don’t add up to 100%.