
This blog is part of a series related to Gov 1347: Election Analytics, a course at Harvard University taught by Professor Ryan D. Enos.
This week, I am diving into TV advertising spending done by presidential candidates. I start by looking at the historical rise of TV advertising in presidential elections. Then, I’ll present spending data by presidential candidates on TV ads in the past few elections. This data will be used to create a model to try to predict the 2020 electoral map solely based on the proportion of TV ad dominance by each candidate and the party of each candidate.
TV ads in Presidential Elections
Political TV advertisements have come a long way since the first one was introduced in the 1952 presidential election - Eisenhower Answers America. Filmed by Rosser Reeves, the purpose of the ad series was to allow Eisenhower to quickly pitch some of his ideas to the American people and gain their support. Fast-forward a few years, and the first negative political TV ad was created - the infamous Daisy ad by Lyndon Johnson used in the 1964 election.
Today, if you live in or near a battleground state, then you can’t watch MSNBC, CNN, or Fox News without seeing at least one political advertisement on TV. But how effective really are these advertisements? Are they really able to sway an election or persuade voters?
Well, it really depends how you define the effectiveness of an ad. There is evidence that the effects of TV ads on voters are relatively short lived. But, there is also evidence that these ads are able to persuade people. So, if you were running for president, I’d probably tell you to consistently run ads so that people are constantly seeing them during the election year. In the few weeks leading up to election day, buy as many TV ads as you can.
This is pretty much exactly what the Trump and Biden campaigns are doing right now.
Recent Spending on TV ads
Going along the hypothetical advice I gave above, one might expect this to cause concerns in terms of campaign finance - and that is exactly true. There is a huge amount of money going to political TV ads in presidential elections. Looking at the data below from Wesleyan Media Project on how much presidential campaigns spent in the early 21st century, we can see a steady increase in the amount of money being poured into TV ads:
Assuming that this increasing trend has stayed consistent for 2020, we can expect to see over a billion dollars spent by the Trump campaign, the Republican party, and PACs just for his re-election. And this prediction is entirely possible given that the Trump campaign has already raised and spent more than a billion dollars by themselves (that’s excluding the money spent by the party and PACs).
This year, preliminary data from the Federal Elections Commission show that Biden and Trump have together spent about 752 million dollars on TV ads from April to September. Obama’s 2012 re-election campaign alone spent about 500 million on TV ads, so we can expect Trump and Biden to spend a bit more on ads this month before election day.
2020 Prediction Model
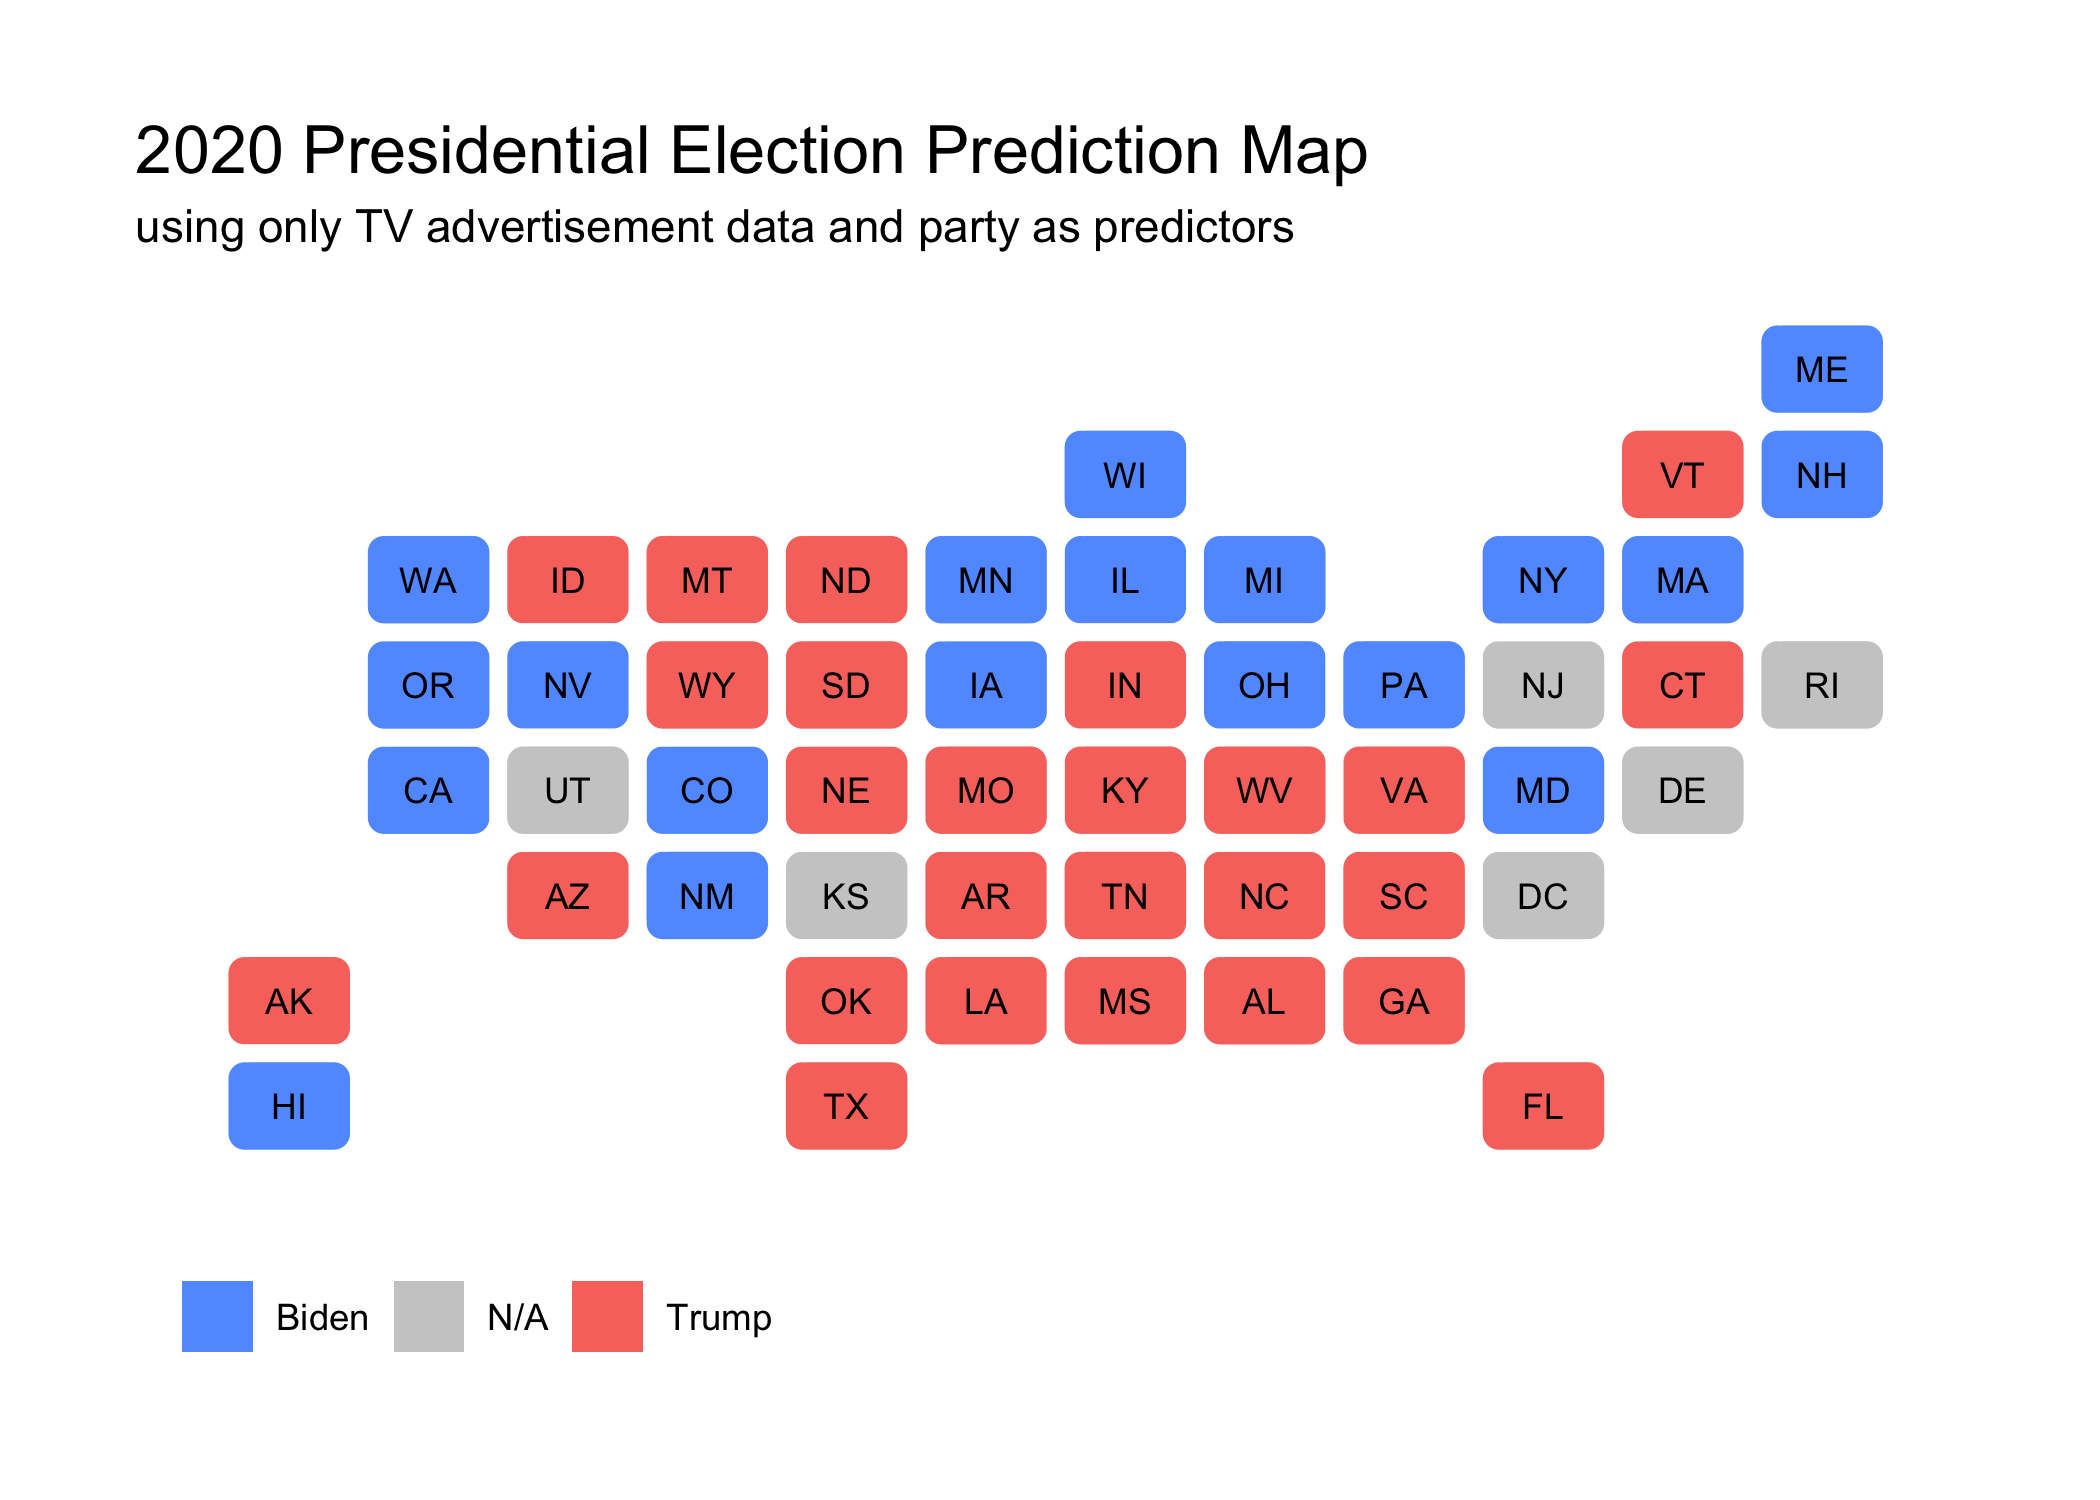
But, what can we do with all this TV ad data? And is this data useful in our 2020 forecast models? I created a logistic model using the proportion of TV ad dominance for each state and candidate party to try and predict Biden and Trump’s 2020 voteshare in each state. This model uses the Wesleyan Media Project data on the presidential campaigns between 2000 to 2012. The candidate with a higher predicted voteshare for each state is presented on the map below:

Proportion of TV ad dominance is calculated using the money spent on TV ads per state in the model. However, this data is not available for 2020 yet, so instead it is calculated using the number of TV ads run per state.
While this model predict isn’t completely incorrect - it is extremely limited as it only uses data from 4 elections at most (as few as 1 row of data for some states!) The gray N/A states are where there was no TV ad data from 2000 to 2012 or no TV ad data in 2020. Looking at the results in their current state, Biden is predicted to win 279 electoral votes, 223 for Trump, and 36 N/As.
However, this model has some major flaws in the predictions. For example, Vermont, Connecticut, and Virginia tend to be blue states (Clinton also won all 3 in 2016). Adjusting for these flaws and giving NJ, RI, DE, and DC to Biden as well - the gray states that lean Democratic - then this model gives Biden 314 of the electoral votes. While this map also doesn’t take into account the split electoral votes in Maine and Nebraska, that wouldn’t change the forecast for Biden’s victory.
Issues with TV ad data
While this model makes a realistic prediction after slight adjustments, I still would not use it as a predictor for my 2020 forecast for several reasons:
The historical data is too limited. State-level data for polls already have varying degrees of reliability. The even more limited amount of TV ad data is just not enough to justify it’s accuracy and usefulness in a 2020 forecast model. This limited amount of data also makes in-sample fit statistics (R-Squared for example) not useful and out-of-sample testing impossible.
It is unclear the exact degree of importance TV ads have in presidential elections. In connection to the limited amount of data, it is difficult to determine just how much TV ads effect the presidential election.
There are better predictors out there. National polls, the economy, incumbency, etc. These are other sources of data that are more plentiful and have already been used to create very good models in the past.